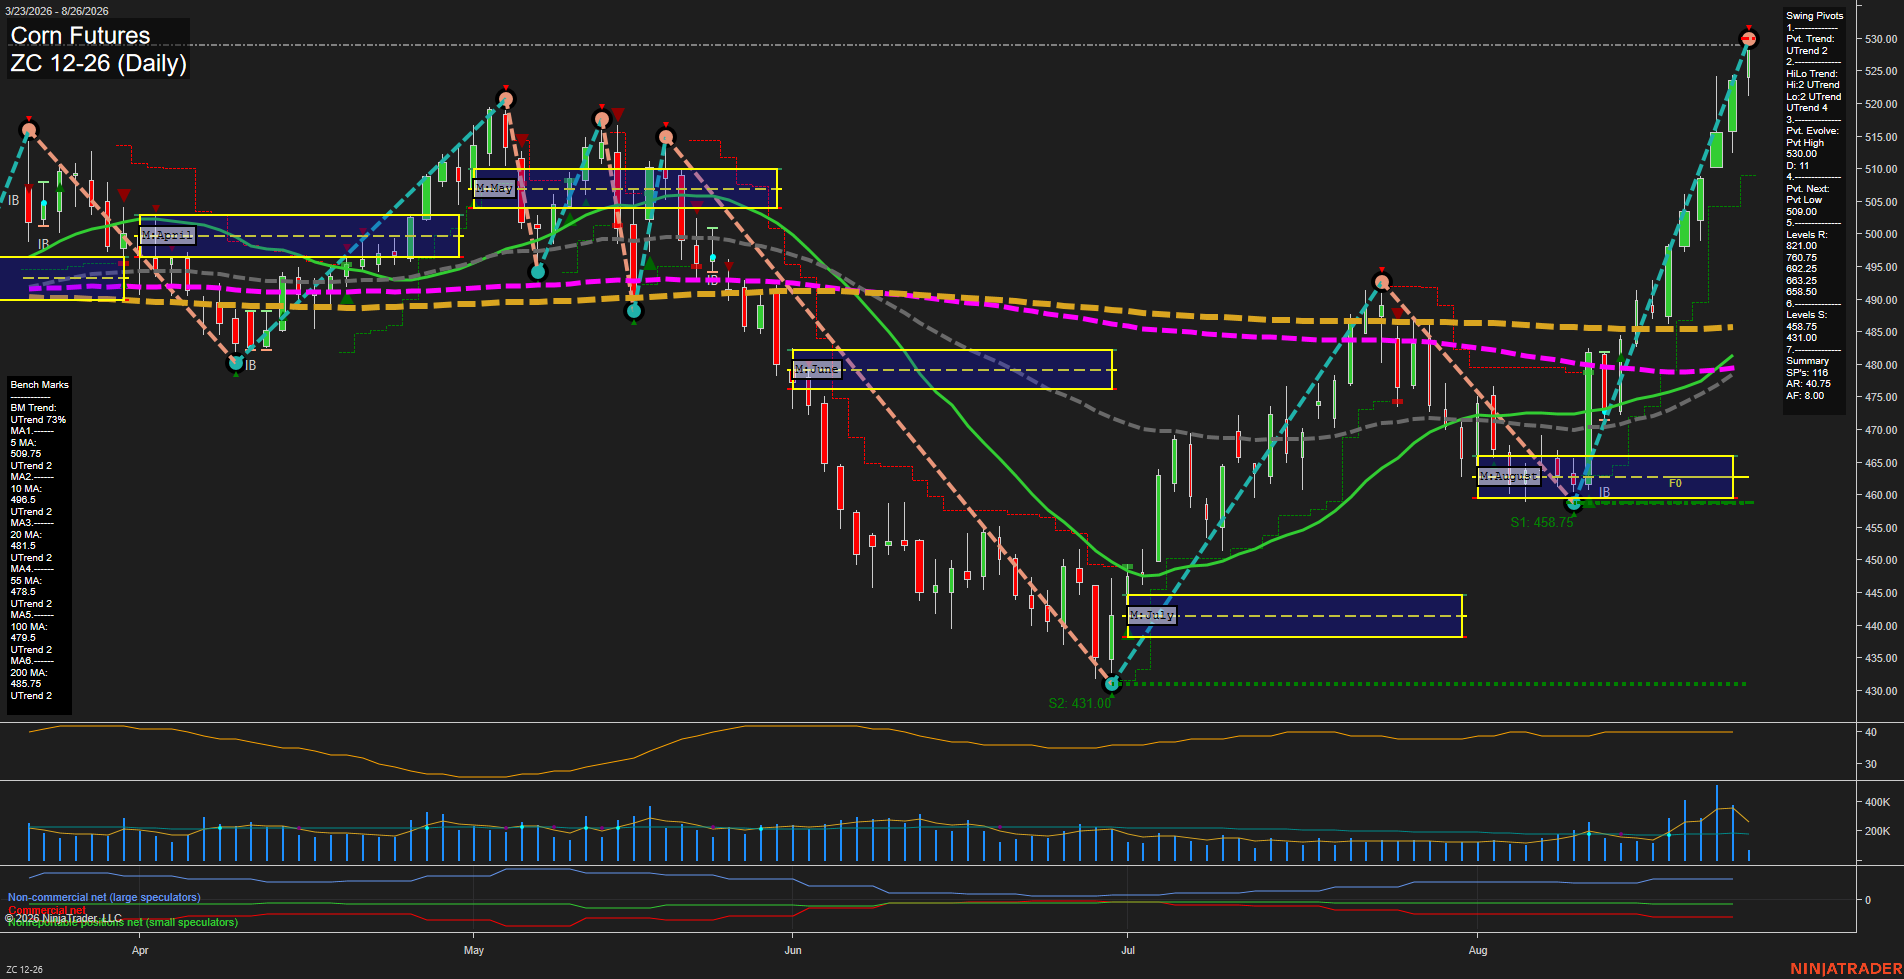
ZC Corn Futures Daily Chart Analysis: 2026-Aug-26 07:14 CT
Price Action
- Last: 530.00,
- Bars: Large,
- Mom: fast.
WSFG Weekly
- Short-Term
- WSFG Current: 80%
- F0%/NTZ' Bias: Price Above,
- WSFG Trend: Up.
MSFG Month Aug
- Intermediate-Term
- MSFG Current: 170%
- F0%/NTZ' Bias: Price Above,
- MSFG Trend: Up.
YSFG Year 2026
- Long-Term
- YSFG Current: 18%
- F0%/NTZ' Bias: Price Above,
- YSFG Trend: Up.
Swing Pivots
- (Short-Term) 1. Pvt. Trend: UTrend,
- (Intermediate-Term) 2. HiLo Trend: UTrend,
- 3. Pvt. Evolve: Pvt high 530.00,
- 4. Pvt. Next: Pvt low 509.00,
- 5. Levels R: 521.00, 500.75,
- 6. Levels S: 458.75, 431.00.
Daily Benchmarks
- (Short-Term) 5 Day: 509.75 Up Trend,
- (Short-Term) 10 Day: 496.50 Up Trend,
- (Intermediate-Term) 20 Day: 481.50 Up Trend,
- (Intermediate-Term) 55 Day: 478.50 Up Trend,
- (Long-Term) 100 Day: 479.50 Up Trend,
- (Long-Term) 200 Day: 485.75 Up Trend.
Additional Metrics
Overall Rating
- Short-Term: Bullish,
- Intermediate-Term: Bullish,
- Long-Term: Bullish.
Key Insights Summary
Price is extending a powerful August V-recovery into a fresh pivot high near 530.00, with large-range bars and fast momentum confirming an accelerated upside phase. The short-term pivot structure, weekly and monthly fib-grid positioning, and all benchmark averages are aligned upward. Price is materially above the 5-day through 200-day averages, reflecting broad trend participation after the July low. The 509.00 pivot-next level is the nearest short-term structural reference, while 521.00 and 500.75 mark prior resistance areas now below the market. Rising ATR and elevated volume activity accompany the breakout, indicating expanded daily range and strong directional participation.
Chart Analysis ATS AI Generated: 2026-08-26 07:14 for Informational use only, not trading advice. Terms and Risk Disclosure Copyright © 2026. Algo Trading Systems LLC.