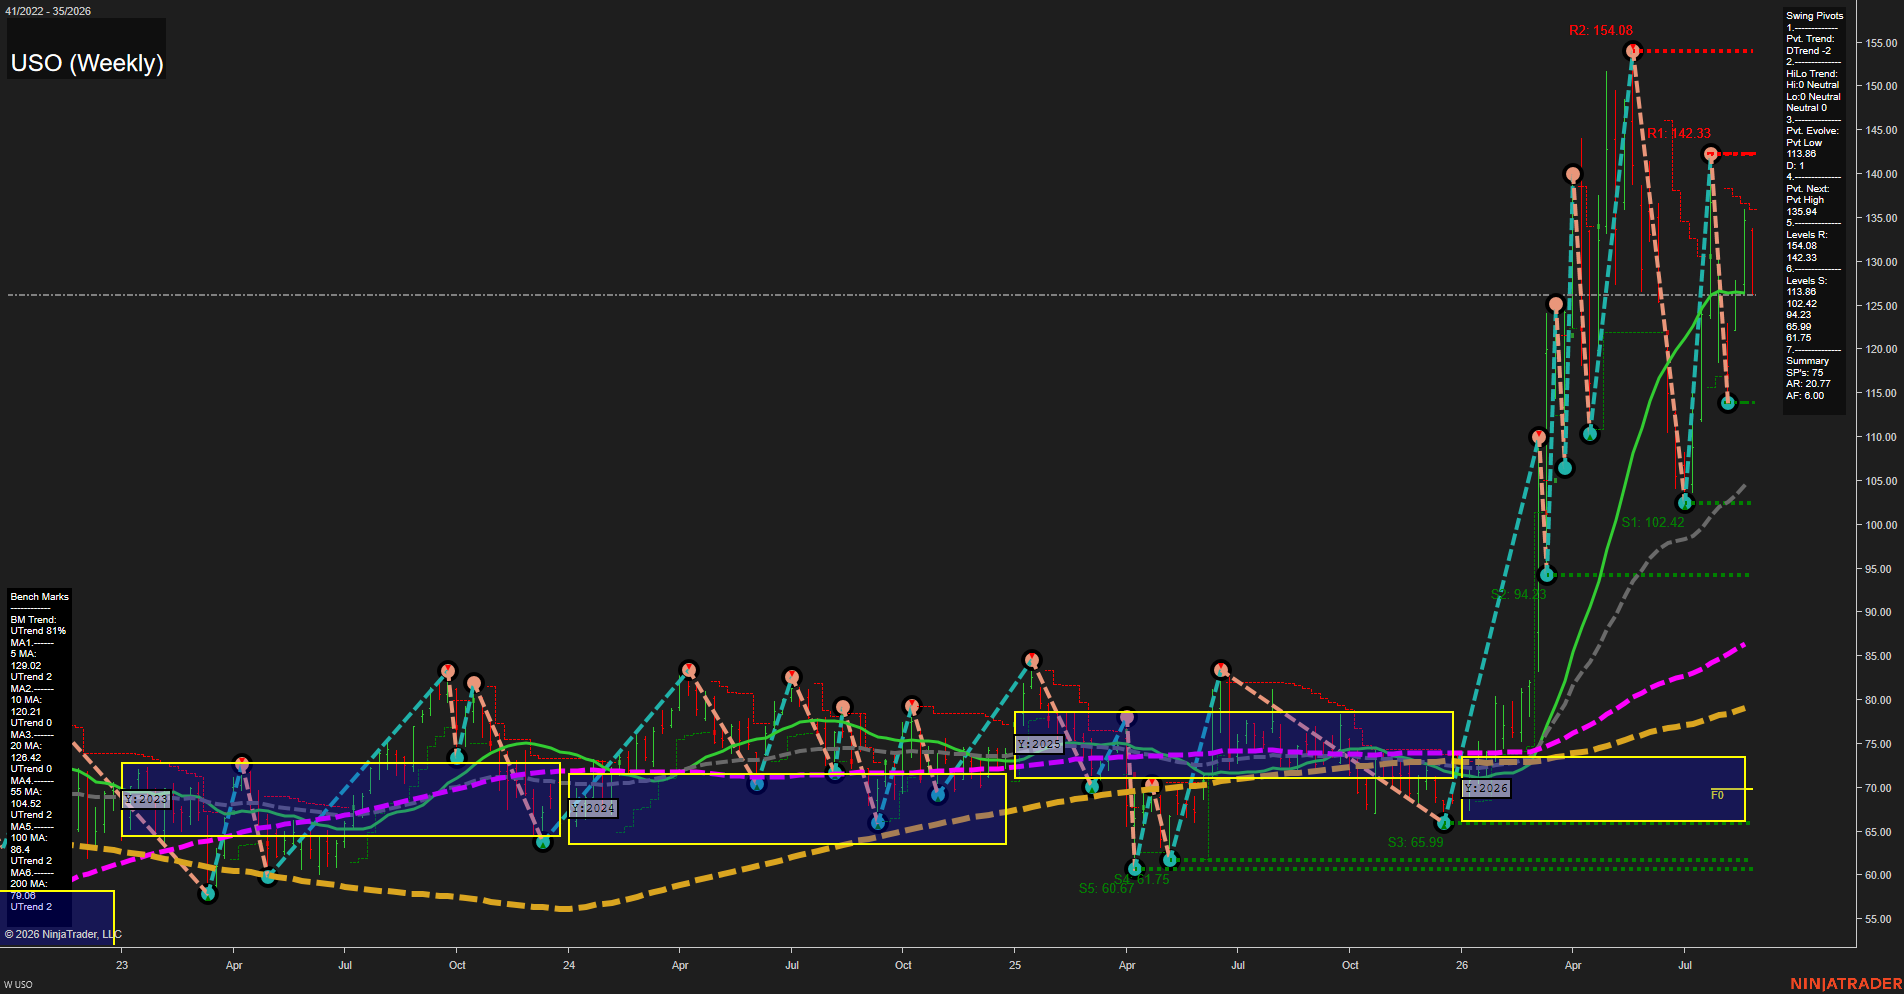
USO United States Oil Fund LP Weekly Chart Analysis: 2026-Aug-26 07:12 CT
Price Action
- Last: 126.00,
- Bars: Large,
- Mom: Fast.
WSFG Weekly
- Short-Term
- WSFG Current: NA%
- F0%/NTZ' Bias: Price Above NTZ,
- WSFG Trend: Bullish.
MSFG Month Aug
- Intermediate-Term
- MSFG Current: NA%
- F0%/NTZ' Bias: Price Above NTZ,
- MSFG Trend: Bullish.
YSFG Year 2026
- Long-Term
- YSFG Current: NA%
- F0%/NTZ' Bias: Price Above NTZ,
- YSFG Trend: Bullish.
Swing Pivots
- (Short-Term) 1. Pvt. Trend: DTrend,
- (Intermediate-Term) 2. HiLo Trend: UTrend,
- 3. Pvt. Evolve: Pvt low 113.86,
- 4. Pvt. Next: Pvt high 135.94,
- 5. Levels R: 154.08, 142.33,
- 6. Levels S: 113.86, 102.42, 94.23, 65.99, 61.75.
Weekly Benchmarks
- (Short-Term) 5 Day: 129.02 Up Trend,
- (Short-Term) 10 Day: 110.82 Up Trend,
- (Intermediate-Term) 20 Day: 126.00 Up Trend,
- (Intermediate-Term) 55 Day: 104.52 Up Trend,
- (Long-Term) 100 Day: 86.40 Up Trend,
- (Long-Term) 200 Day: 78.00 Up Trend.
Overall Rating
- Short-Term: Neutral,
- Intermediate-Term: Bullish,
- Long-Term: Bullish.
Key Insights Summary
USO remains in a powerful higher-timeframe expansion above the 2026 yearly value area and all visible benchmark averages, confirming a bullish intermediate and long-term structure. The short-term pivot state is DTrend following rejection from 142.33 and the prior 154.08 extreme, while the evolving 113.86 pivot low defines the current pullback structure. Price has rebounded sharply from the 102.42 support area and is now consolidating around the rising 20-period benchmark near 126.00. The 135.94 pivot-next level is the near-term structural inflection, with 142.33 and 154.08 representing the larger overhead swing-high levels. The wide weekly bars and fast momentum reflect an elevated-volatility energy cycle rather than a smooth trend, with 113.86 remaining the principal support separating the current recovery from a deeper retracement.
Chart Analysis ATS AI Generated: 2026-08-26 07:13 for Informational use only, not trading advice. Terms and Risk Disclosure Copyright © 2026. Algo Trading Systems LLC.