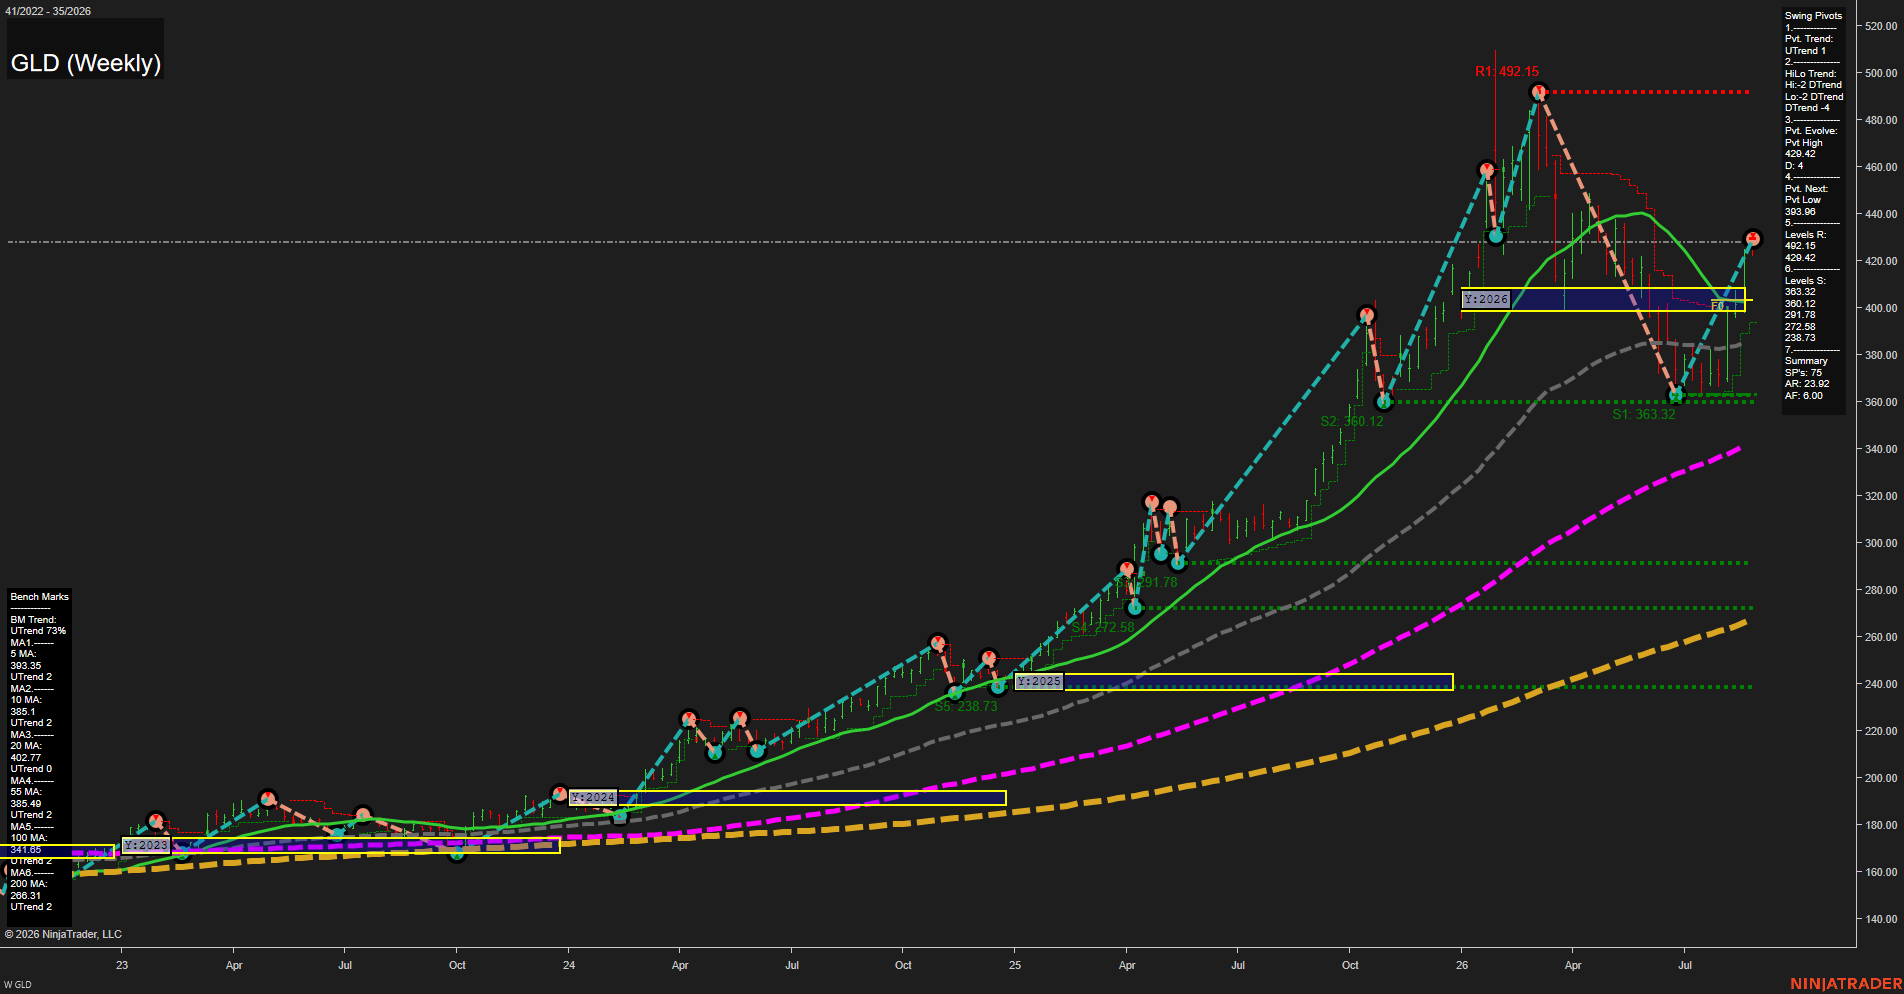
GLD SPDR Gold Shares Weekly Chart Analysis: 2026-Aug-26 07:07 CT
Price Action
- Last: 429.25,
- Bars: Medium,
- Mom: fast.
WSFG Weekly
- Short-Term
- WSFG Current: NA%
- F0%/NTZ' Bias: Price Neutral,
- WSFG Trend: Neutral.
MSFG Month Aug
- Intermediate-Term
- MSFG Current: NA%
- F0%/NTZ' Bias: Price Neutral,
- MSFG Trend: Neutral.
YSFG Year 2026
- Long-Term
- YSFG Current: 75%
- F0%/NTZ' Bias: Price Bullish,
- YSFG Trend: UTrend.
Swing Pivots
- (Short-Term) 1. Pvt. Trend: UTrend,
- (Intermediate-Term) 2. HiLo Trend: DTrend,
- 3. Pvt. Evolve: Pvt high 429.42,
- 4. Pvt. Next: Pvt low 393.98,
- 5. Levels R: 492.15, 429.42,
- 6. Levels S: 363.32, 360.12, 291.78, 272.58, 238.73.
Weekly Benchmarks
- (Short-Term) 5 Day: 393.58 Up Trend,
- (Short-Term) 10 Day: 385.10 Up Trend,
- (Intermediate-Term) 20 Day: 402.77 Up Trend,
- (Intermediate-Term) 55 Day: 385.49 Up Trend,
- (Long-Term) 100 Day: 341.05 Up Trend,
- (Long-Term) 200 Day: 268.91 Up Trend.
Overall Rating
- Short-Term: Bullish,
- Intermediate-Term: Bullish,
- Long-Term: Bullish.
Key Insights Summary
GLD’s weekly structure, a proxy for the corresponding gold futures trend, reflects a strong recovery from the 363.32 swing-low area into the 429.42 pivot-high zone. Price is above every benchmark average, with the 20-, 55-, 100-, and 200-period averages all rising, confirming broad multi-timeframe trend alignment. The short-term pivot trend has turned higher, although the intermediate HiLo trend remains DTrend after the prior decline from 492.15. The current rally is testing pivot resistance near 429.42, while 492.15 remains the major overhead swing reference. The 393.98 reversal level and the rising 20-period average near 402.77 define the nearest structural retracement zone; deeper support remains concentrated at 363.32-360.12. The yearly grid positioning above F0% and the NTZ indicates a bullish long-term price location, while the fast rebound character suggests elevated weekly volatility.
Chart Analysis ATS AI Generated: 2026-08-26 07:07 for Informational use only, not trading advice. Terms and Risk Disclosure Copyright © 2026. Algo Trading Systems LLC.