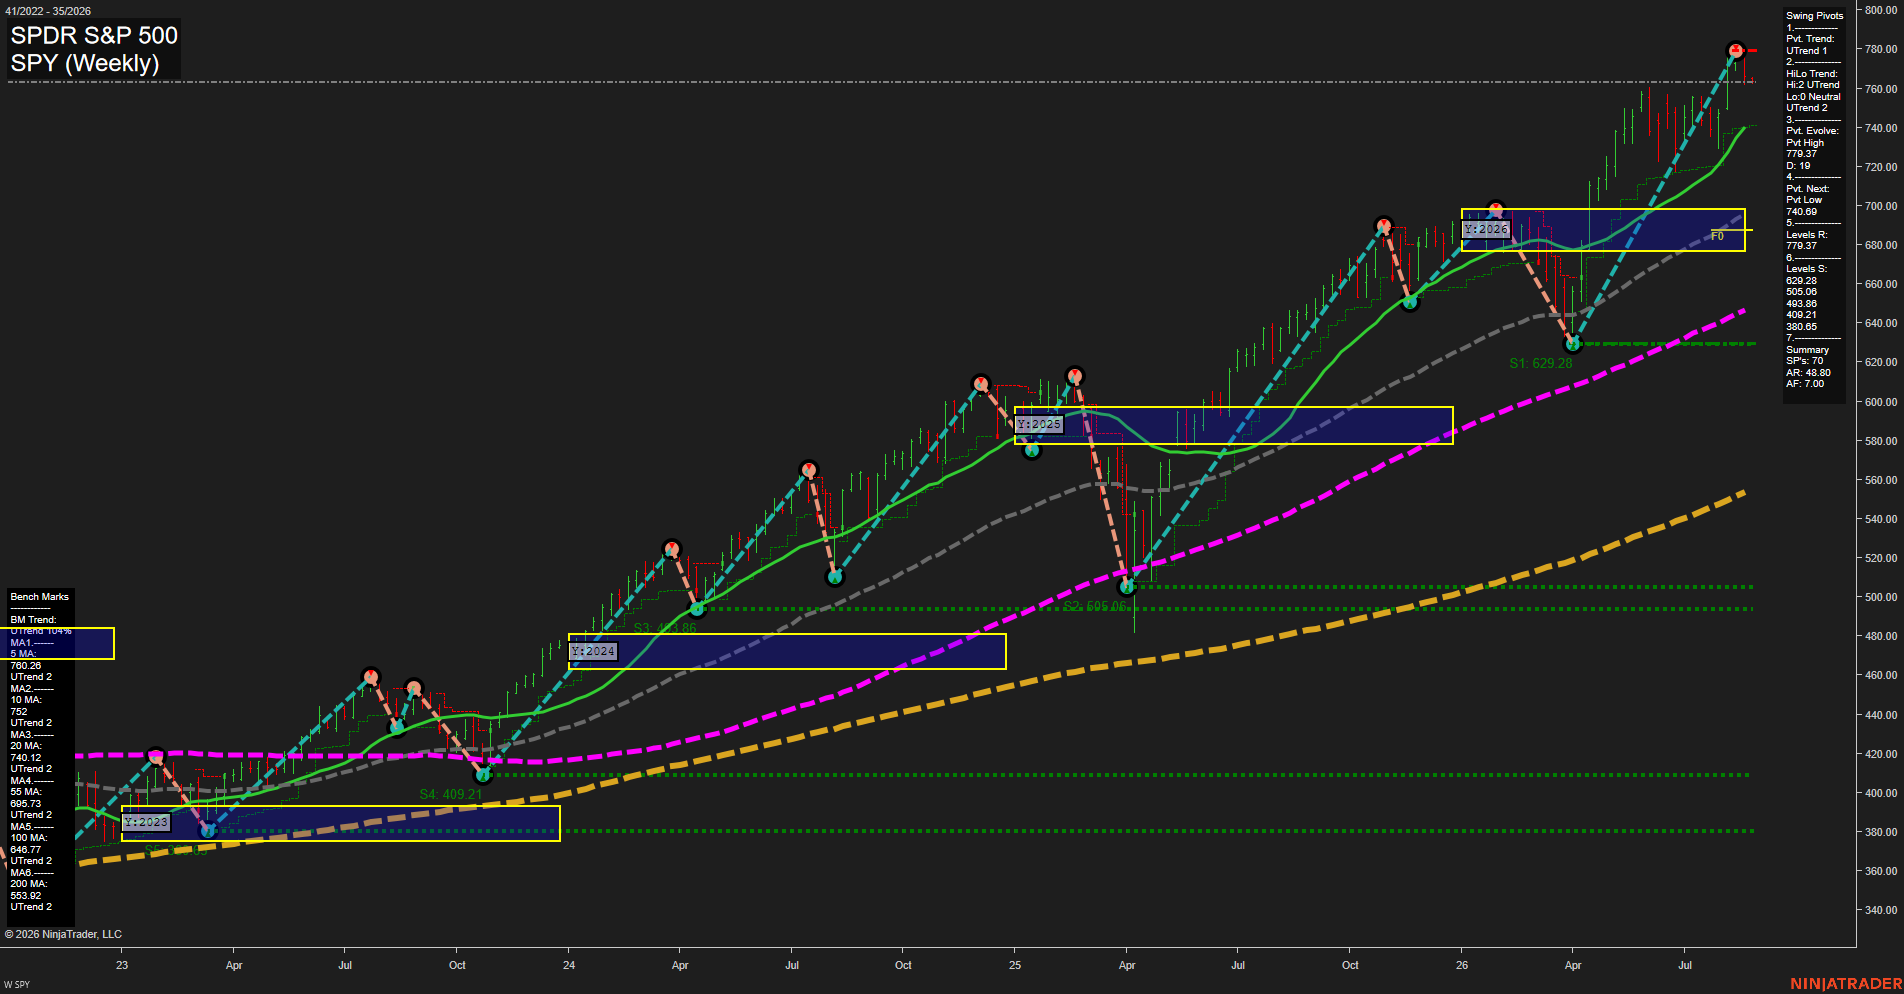
SPY SPDR S&P 500 Weekly Chart Analysis: 2026-Aug-25 07:12 CT
Price Action
- Last: 763.00,
- Bars: Medium,
- Mom: Average.
WSFG Weekly
- Short-Term
- WSFG Current: NA%
- F0%/NTZ' Bias: Price Neutral,
- WSFG Trend: Neutral.
MSFG Month Aug
- Intermediate-Term
- MSFG Current: NA%
- F0%/NTZ' Bias: Price Neutral,
- MSFG Trend: Neutral.
YSFG Year 2026
- Long-Term
- YSFG Current: Above NTZ,
- F0%/NTZ' Bias: Price Bullish,
- YSFG Trend: Bullish.
Swing Pivots
- (Short-Term) 1. Pvt. Trend: UTrend,
- (Intermediate-Term) 2. HiLo Trend: UTrend,
- 3. Pvt. Evolve: Pvt high 779.37,
- 4. Pvt. Next: Pvt low 674.39,
- 5. Levels R: 779.37,
- 6. Levels S: 674.39, 650.68, 493.38, 409.21, 380.65.
Weekly Benchmarks
- (Short-Term) 5 Day: 760.26 Up Trend,
- (Short-Term) 10 Day: 752.00 Up Trend,
- (Intermediate-Term) 20 Day: 740.22 Up Trend,
- (Intermediate-Term) 55 Day: 695.73 Up Trend,
- (Long-Term) 100 Day: 646.77 Up Trend,
- (Long-Term) 200 Day: 553.92 Up Trend.
Overall Rating
- Short-Term: Bullish,
- Intermediate-Term: Bullish,
- Long-Term: Bullish.
Key Insights Summary
The weekly structure remains broadly bullish for an index-futures swing-trader perspective: price is above every benchmark average, the moving-average stack is positively aligned, and both the short-term pivot trend and intermediate HiLo trend remain in UTrend conditions. The recent advance has become choppier near the 779.37 pivot-high resistance, producing a pullback from an extended high rather than a confirmed weekly structural reversal. The 760.26 and 752.00 short-term benchmarks define the immediate trend zone, while 740.22 is the principal intermediate swing reference. A decline through 674.39 would establish the next opposite pivot and materially alter the current higher-high, higher-low structure. The yearly grid is being traded well above its NTZ, reflecting a long-term extended bullish condition rather than a neutral yearly balance.
Chart Analysis ATS AI Generated: 2026-08-25 07:12 for Informational use only, not trading advice. Terms and Risk Disclosure Copyright © 2026. Algo Trading Systems LLC.