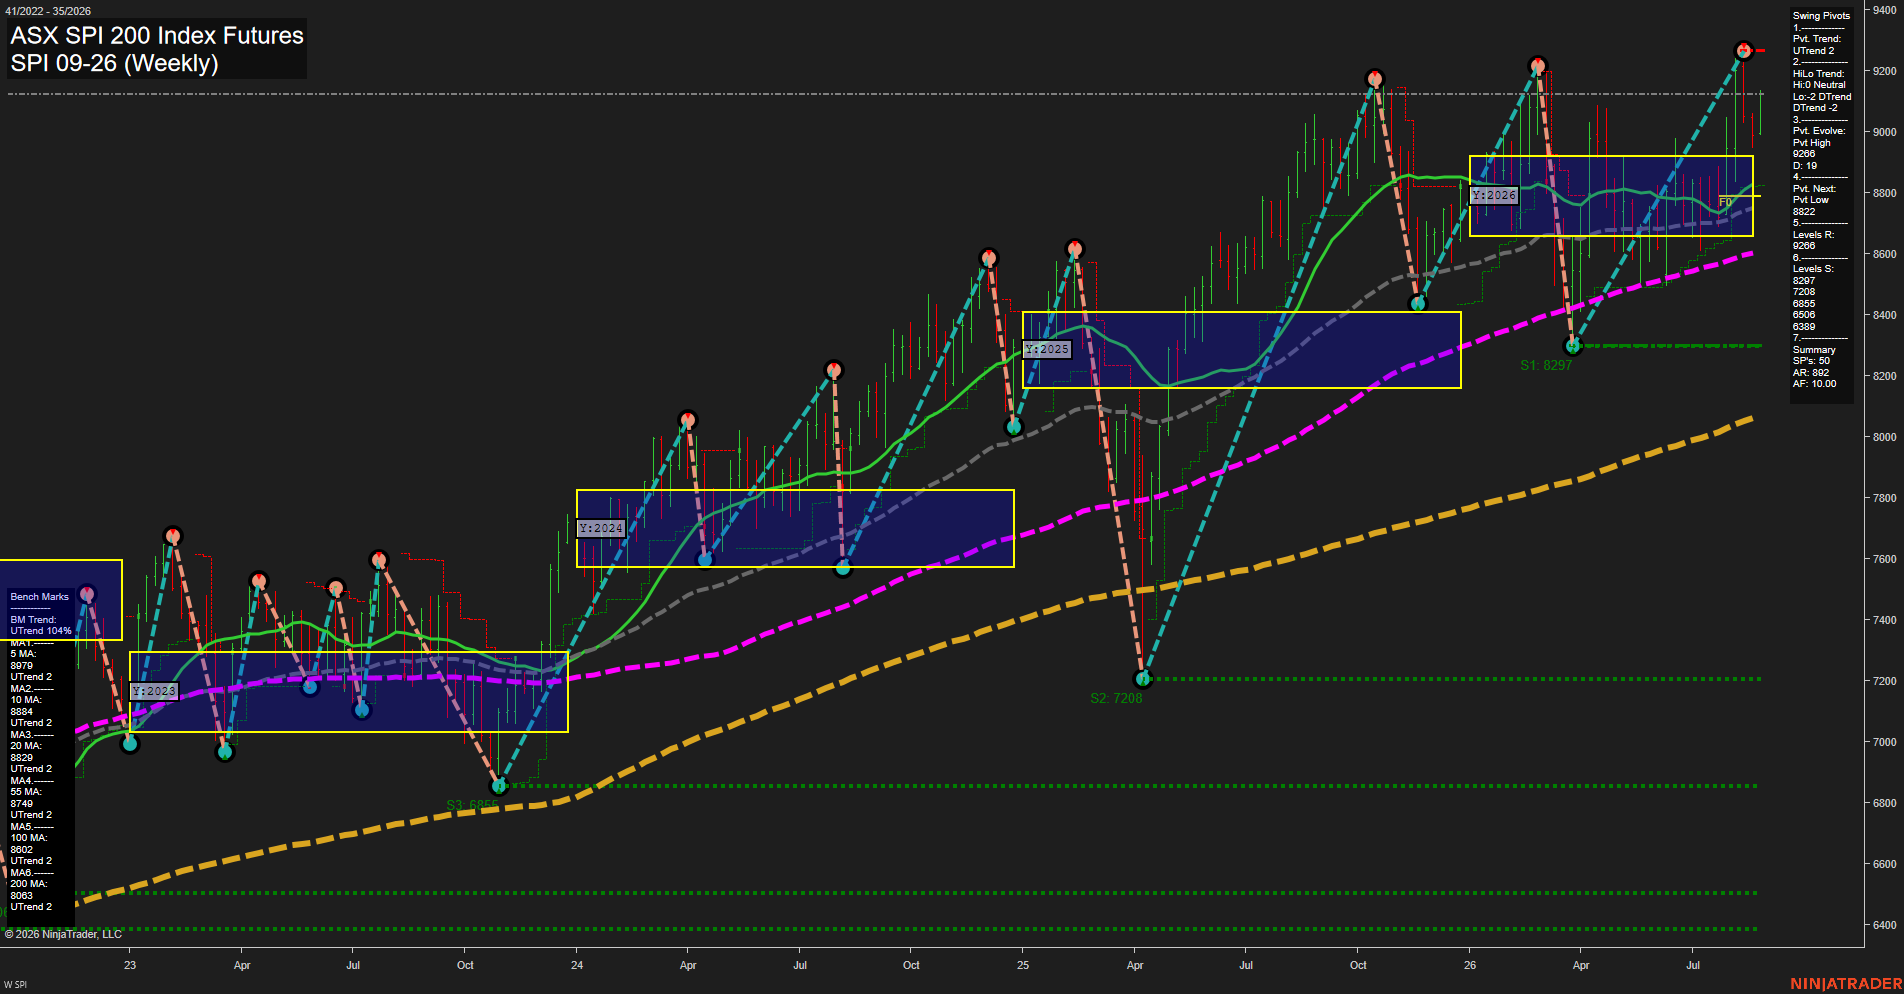
SPI ASX SPI 200 Index Futures Weekly Chart Analysis: 2026-Aug-25 07:11 CT
Price Action
- Last: 9226,
- Bars: Medium,
- Mom: Average.
WSFG Weekly
- Short-Term
- WSFG Current: NA%
- F0%/NTZ' Bias: Price Above NTZ,
- WSFG Trend: Bullish.
MSFG Month Aug
- Intermediate-Term
- MSFG Current: NA%
- F0%/NTZ' Bias: Price Above NTZ,
- MSFG Trend: Bullish.
YSFG Year 2026
- Long-Term
- YSFG Current: NA%
- F0%/NTZ' Bias: Price Above NTZ,
- YSFG Trend: Bullish.
Swing Pivots
- (Short-Term) 1. Pvt. Trend: UTrend,
- (Intermediate-Term) 2. HiLo Trend: DTrend,
- 3. Pvt. Evolve: Pvt high 9266,
- 4. Pvt. Next: Pvt low 8822,
- 5. Levels R: 9266,
- 6. Levels S: 8297, 7208, 6855, 6506, 6339.
Weekly Benchmarks
- (Short-Term) 5 Day: 8979 Up Trend,
- (Short-Term) 10 Day: 8884 Up Trend,
- (Intermediate-Term) 20 Day: 8829 Up Trend,
- (Intermediate-Term) 55 Day: 8749 Up Trend,
- (Long-Term) 100 Day: 8602 Up Trend,
- (Long-Term) 200 Day: 8053 Up Trend.
Overall Rating
- Short-Term: Bullish,
- Intermediate-Term: Bullish,
- Long-Term: Bullish.
Key Insights Summary
Price is holding above the yearly neutral zone and all rising weekly benchmarks, reflecting a broad bullish structure. The short-term pivot trend remains upward, although the 9266 pivot high is the immediate resistance reference after the recent test and rejection near the high. The intermediate pivot structure remains corrective relative to the larger advance, with 8822 marking the next pivot-low reversal level. The chart retains a higher-level recovery pattern from the April low, while recent medium-sized bars indicate a more measured, consolidative momentum phase beneath the 9266 high.
Chart Analysis ATS AI Generated: 2026-08-25 07:12 for Informational use only, not trading advice. Terms and Risk Disclosure Copyright © 2026. Algo Trading Systems LLC.