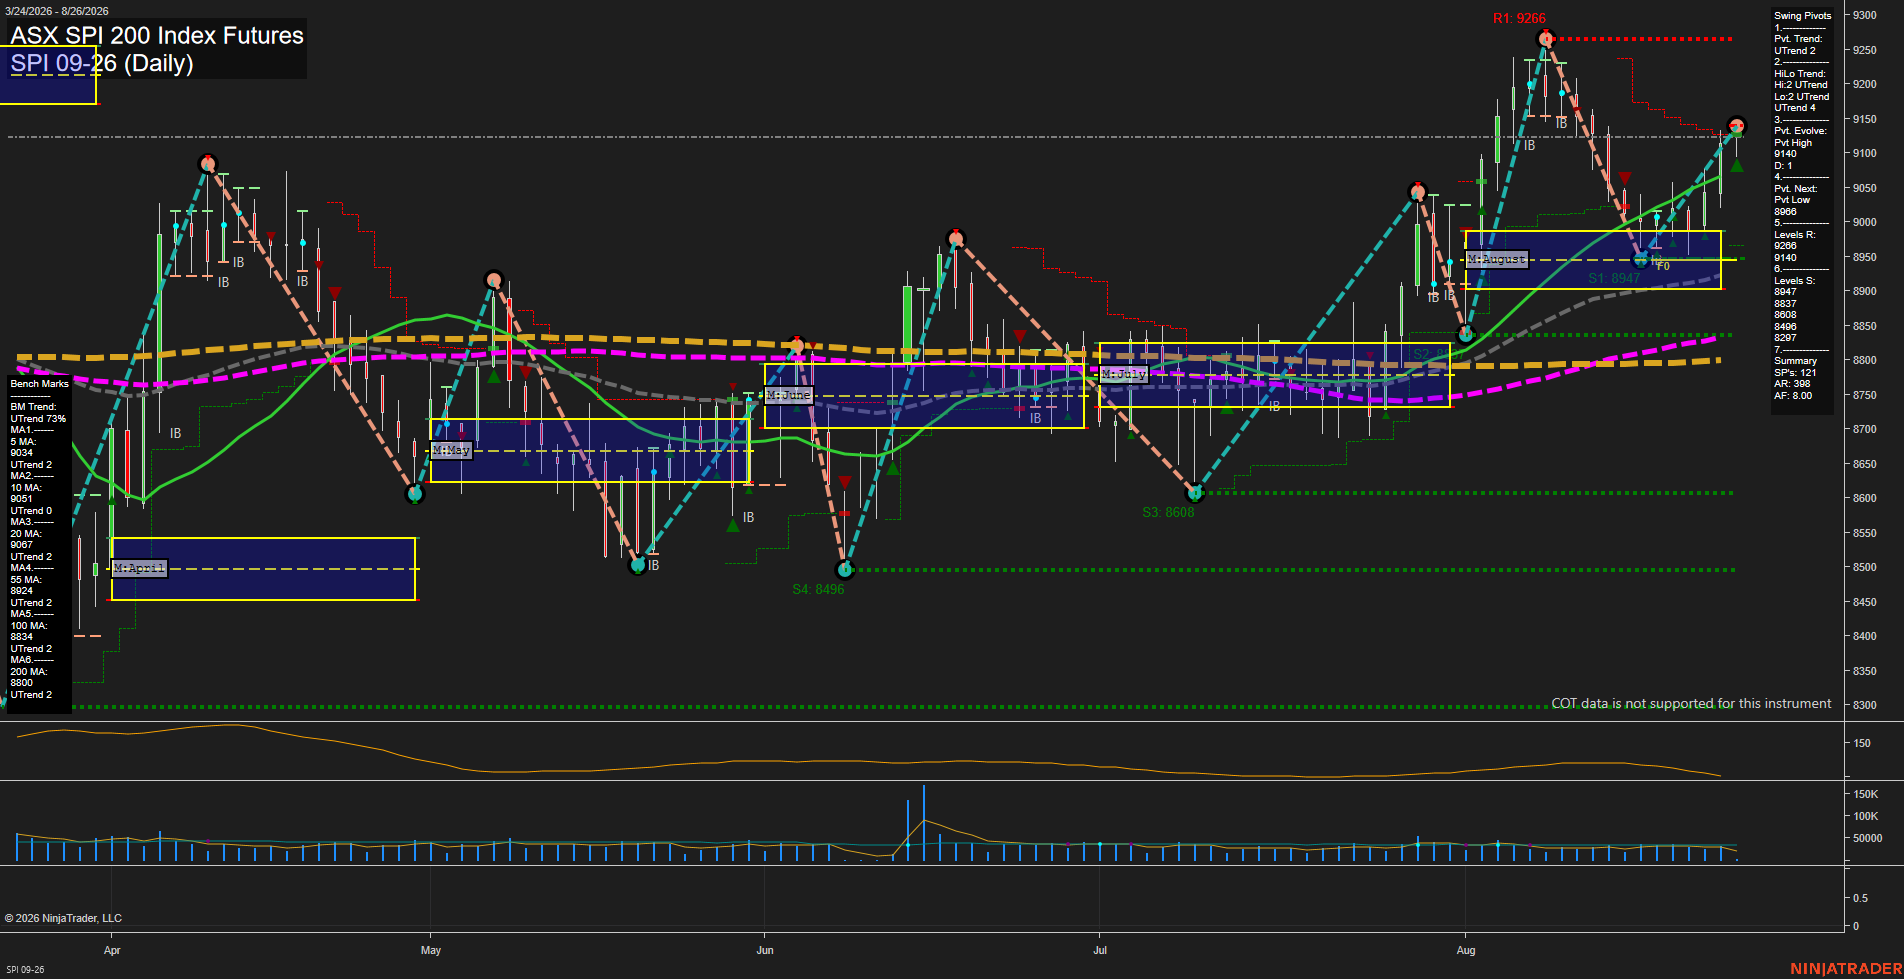
SPI ASX SPI 200 Index Futures Daily Chart Analysis: 2026-Aug-25 07:11 CT
Price Action
- Last: 9140,
- Bars: Medium,
- Mom: Fast.
WSFG Weekly
- Short-Term
- WSFG Current: NA%
- F0%/NTZ' Bias: Price Bullish,
- WSFG Trend: UTrend.
MSFG Month Aug
- Intermediate-Term
- MSFG Current: NA%
- F0%/NTZ' Bias: Price Bullish,
- MSFG Trend: UTrend.
YSFG Year 2026
- Long-Term
- YSFG Current: NA%
- F0%/NTZ' Bias: Price Bullish,
- YSFG Trend: UTrend.
Swing Pivots
- (Short-Term) 1. Pvt. Trend: UTrend,
- (Intermediate-Term) 2. HiLo Trend: UTrend,
- 3. Pvt. Evolve: Pvt high 9140,
- 4. Pvt. Next: Pvt low 8986,
- 5. Levels R: 9266, 9140,
- 6. Levels S: 8947, 8837, 8808, 8608, 8496.
Daily Benchmarks
- (Short-Term) 5 Day: 9034 Up Trend,
- (Short-Term) 10 Day: 9051 Up Trend,
- (Intermediate-Term) 20 Day: 9067 Up Trend,
- (Intermediate-Term) 55 Day: 8924 Up Trend,
- (Long-Term) 100 Day: 8834 Up Trend,
- (Long-Term) 200 Day: 8800 Up Trend.
Additional Metrics
Overall Rating
- Short-Term: Bullish,
- Intermediate-Term: Bullish,
- Long-Term: Bullish.
Key Insights Summary
SPI futures have resumed an advancing swing after the August pullback held above the 8947 support area and recovered through the monthly NTZ. Price is above every benchmark average, with all six averages trending higher, while the pivot structure remains higher-high and higher-low positive. The 9140 pivot is the immediate price reference within the current advance, with 9266 the major overhead swing resistance; 8986 and 8947 define the nearest pivot and grid support zone. Momentum has accelerated on the rebound, although the approach toward the prior August high places price in a more extended upswing phase relative to the 20-day average.
Chart Analysis ATS AI Generated: 2026-08-25 07:11 for Informational use only, not trading advice. Terms and Risk Disclosure Copyright © 2026. Algo Trading Systems LLC.