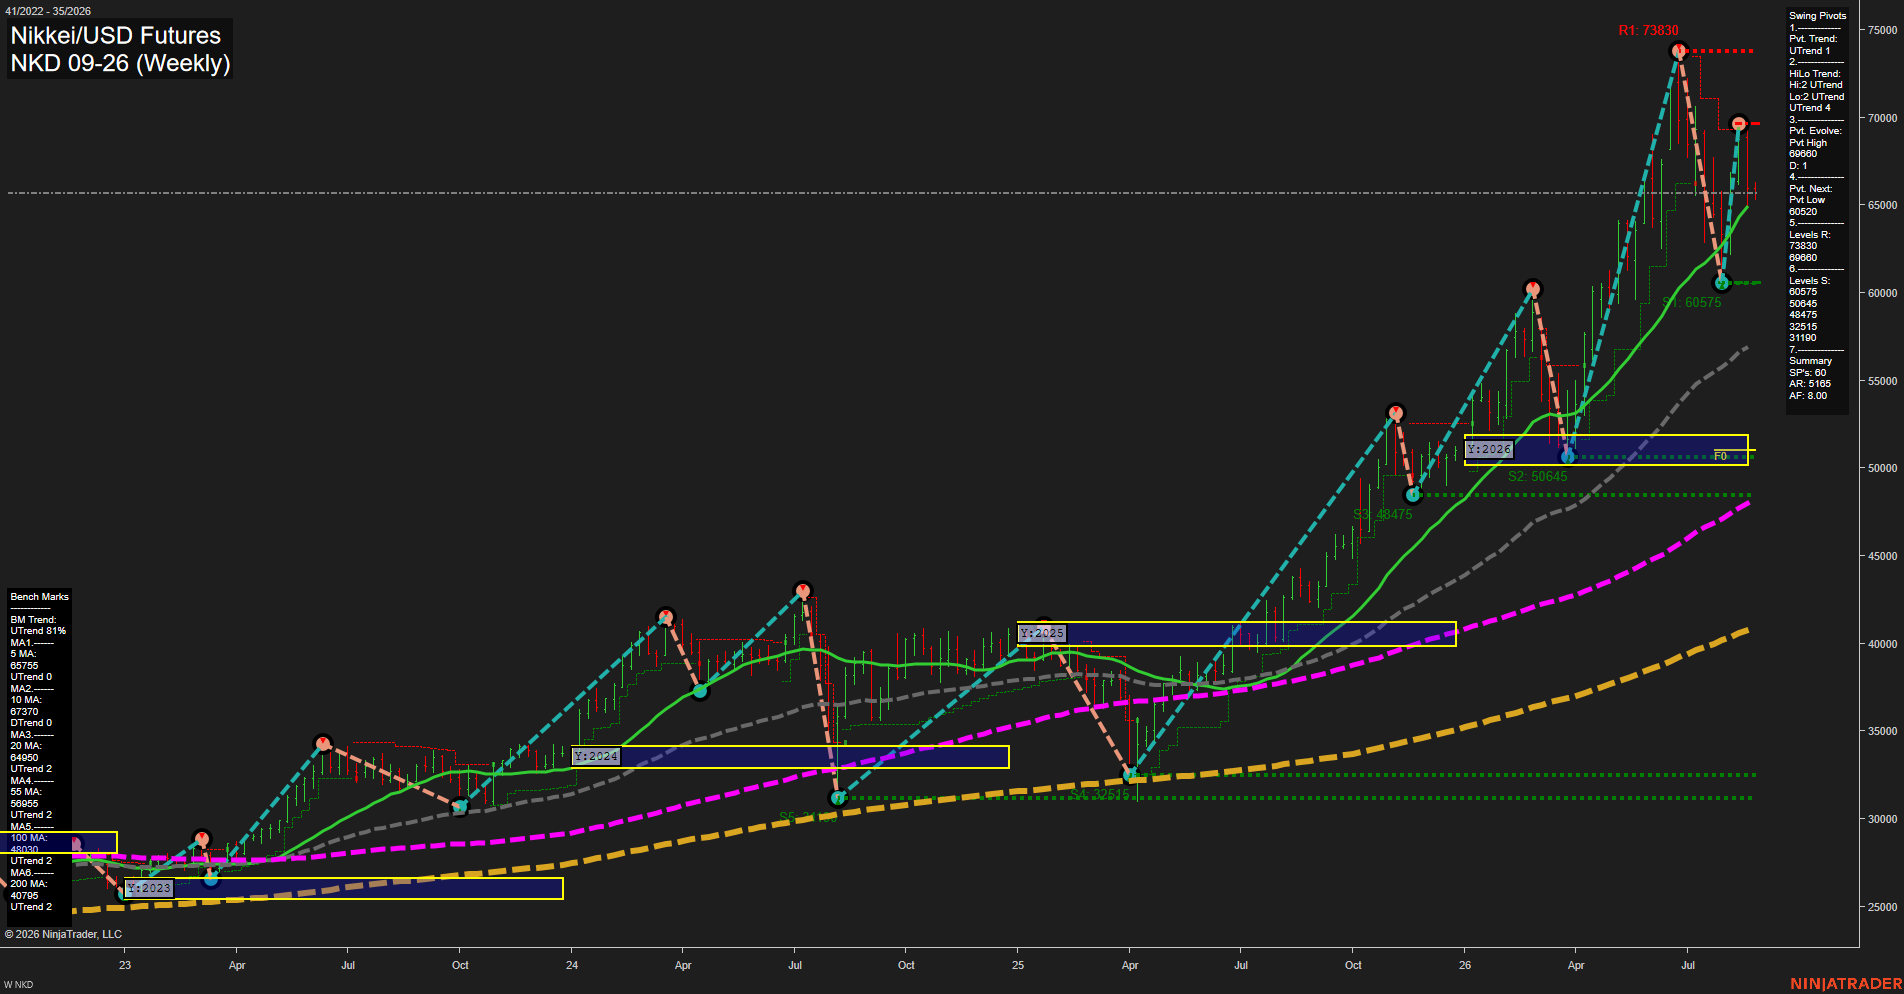
NKD Nikkei/USD Futures Weekly Chart Analysis: 2026-Aug-24 07:07 CT
Price Action
- Last: 65435,
- Bars: Large,
- Mom: Momentum fast.
WSFG Weekly
- Short-Term
- WSFG Current: -5%
- F0%/NTZ' Bias: Price Below,
- WSFG Trend: Down.
MSFG Month Aug
- Intermediate-Term
- MSFG Current: 25%
- F0%/NTZ' Bias: Price Above,
- MSFG Trend: Up.
YSFG Year 2026
- Long-Term
- YSFG Current: 176%
- F0%/NTZ' Bias: Price Above,
- YSFG Trend: Up.
Swing Pivots
- (Short-Term) 1. Pvt. Trend: UTrend,
- (Intermediate-Term) 2. HiLo Trend: UTrend,
- 3. Pvt. Evolve: Pvt high 69660,
- 4. Pvt. Next: Pvt low 60520,
- 5. Levels R: 73830, 69660,
- 6. Levels S: 60575, 50845, 48475, 32515, 31190, 28800.
Weekly Benchmarks
- (Short-Term) 5 Day: 65755 Up Trend,
- (Short-Term) 10 Day: 67370 Down Trend,
- (Intermediate-Term) 20 Day: 64950 Up Trend,
- (Intermediate-Term) 55 Day: 56955 Up Trend,
- (Long-Term) 100 Day: 48030 Up Trend,
- (Long-Term) 200 Day: 40785 Up Trend.
Recent Trade Signals
- 24 Aug 2026: Short NKD 09-26 @ 65435 Signals.USAR-WSFG
- 18 Aug 2026: Short NKD 09-26 @ 68015 Signals.USAR.TR120
Overall Rating
- Short-Term: Bearish,
- Intermediate-Term: Bullish,
- Long-Term: Bullish.
Key Insights Summary
NKD remains in a strong higher-high and higher-low weekly structure, with price substantially above rising 20, 55, 100, and 200 period benchmarks. The short-term picture is corrective and volatile following rejection from the 69660 pivot high, reinforced by weekly grid weakness and recent short signals. Price is testing the 20 period benchmark near 64950 while the 60575 to 60520 pivot-support area defines the key downside swing zone. A recovery through 67370 and 69660 would restore upside pivot momentum, while the broader monthly and yearly fib-grid trends remain firmly upward.
Chart Analysis ATS AI Generated: 2026-08-24 07:07 for Informational use only, not trading advice. Terms and Risk Disclosure Copyright © 2026. Algo Trading Systems LLC.