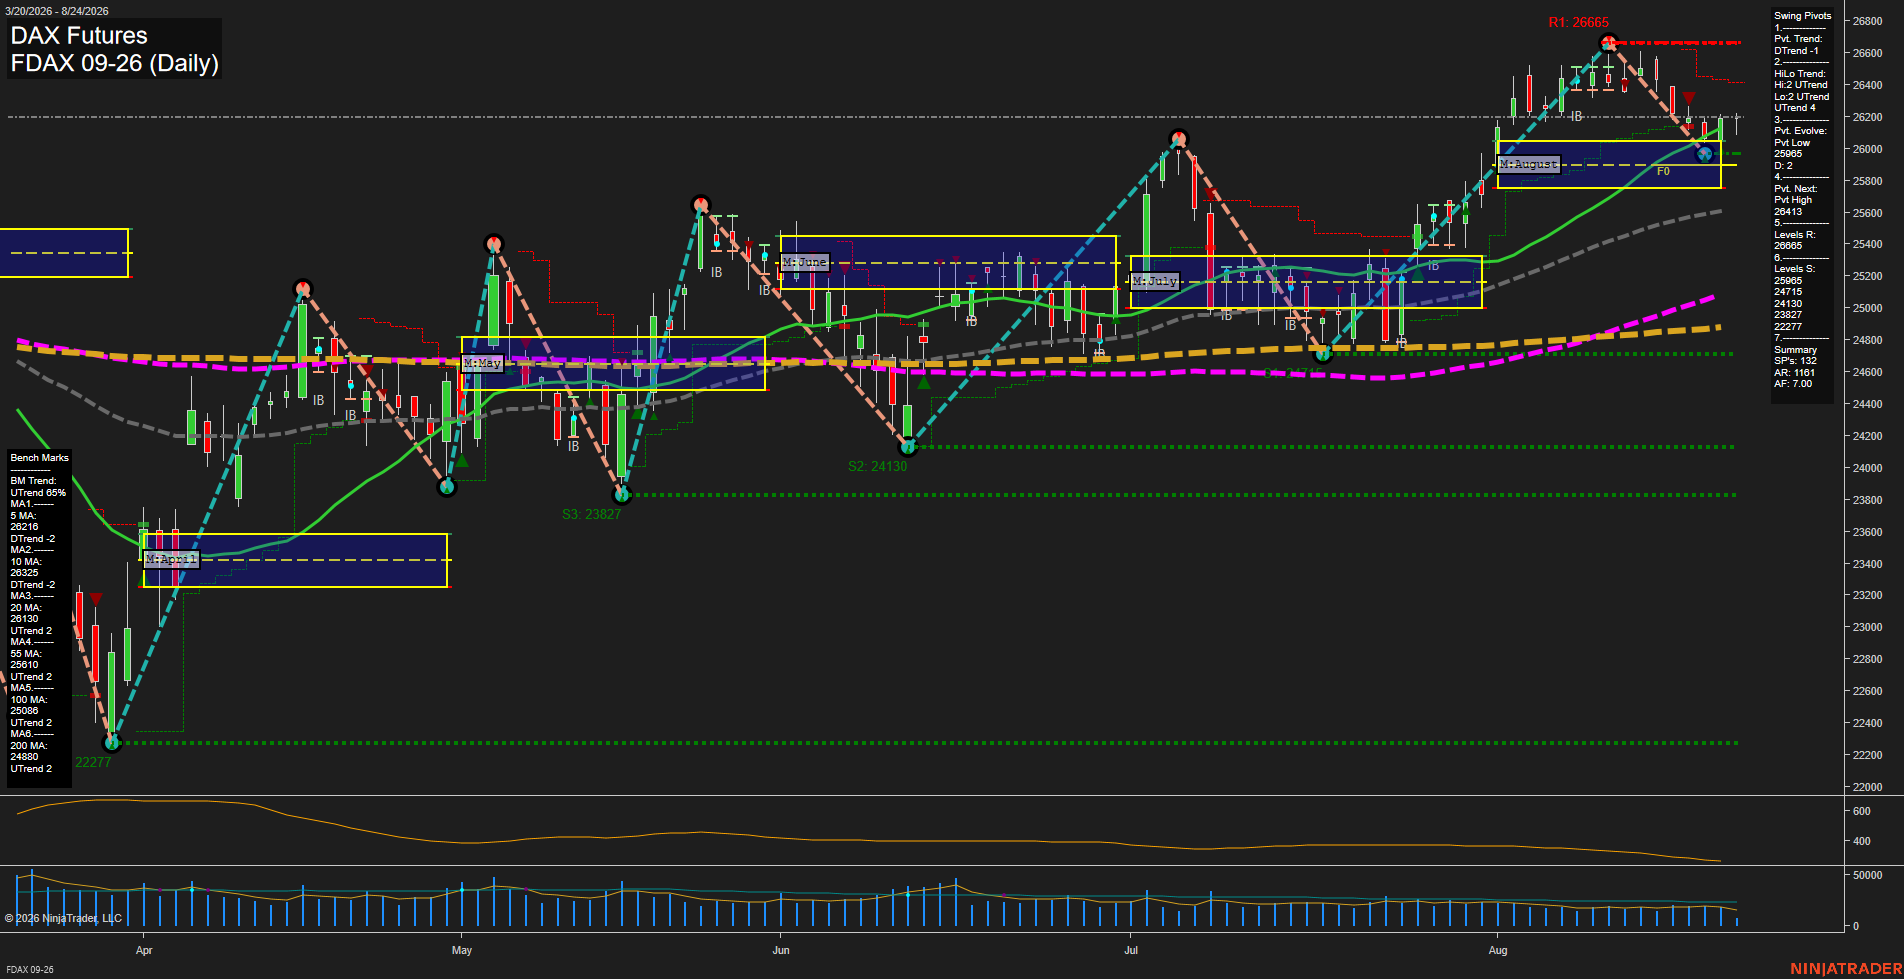
FDAX DAX Futures Daily Chart Analysis: 2026-Aug-24 07:04 CT
Price Action
- Last: 26202,
- Bars: Small,
- Mom: slow.
WSFG Weekly
- Short-Term
- WSFG Current: 0%
- F0%/NTZ' Bias: Price Neutral,
- WSFG Trend: Neutral.
MSFG Month Aug
- Intermediate-Term
- MSFG Current: 21%
- F0%/NTZ' Bias: Price Above,
- MSFG Trend: Up.
YSFG Year 2026
- Long-Term
- YSFG Current: 37%
- F0%/NTZ' Bias: Price Above,
- YSFG Trend: Up.
Swing Pivots
- (Short-Term) 1. Pvt. Trend: DTrend,
- (Intermediate-Term) 2. HiLo Trend: UTrend,
- 3. Pvt. Evolve: Pvt low 25965,
- 4. Pvt. Next: Pvt high 26413,
- 5. Levels R: 26665,
- 6. Levels S: 25965, 24715, 24130, 23827, 22277.
Daily Benchmarks
- (Short-Term) 5 Day: 26216 Down Trend,
- (Short-Term) 10 Day: 26325 Down Trend,
- (Intermediate-Term) 20 Day: 26130 Up Trend,
- (Intermediate-Term) 55 Day: 25610 Up Trend,
- (Long-Term) 100 Day: 25086 Up Trend,
- (Long-Term) 200 Day: 24880 Up Trend.
Additional Metrics
Recent Trade Signals
- 24 Aug 2026: Long FDAX 09-26 @ 26202 Signals.USAR-MSFG
- 21 Aug 2026: Long FDAX 09-26 @ 26187 Signals.USAR.TR120
- 17 Aug 2026: Short FDAX 09-26 @ 26462 Signals.USAR-WSFG
Overall Rating
- Short-Term: Bearish,
- Intermediate-Term: Bullish,
- Long-Term: Bullish.
Key Insights Summary
FDAX remains in a broader bullish structure, holding above rising 20, 55, 100, and 200-day benchmarks, while the August monthly and 2026 yearly fib grids remain positive. Short-term price action is consolidating after rejection from the 26665 pivot resistance, with the pivot trend now down and both 5-day and 10-day benchmarks declining. The 25965 pivot low and rising 20-day average near 26130 define the nearby intermediate support zone, while 26413 and 26665 remain the principal overhead swing references. Small daily bars, declining ATR, and soft volume indicate reduced momentum and a compressed, choppy pullback rather than a broad trend breakdown.
Chart Analysis ATS AI Generated: 2026-08-24 07:05 for Informational use only, not trading advice. Terms and Risk Disclosure Copyright © 2026. Algo Trading Systems LLC.