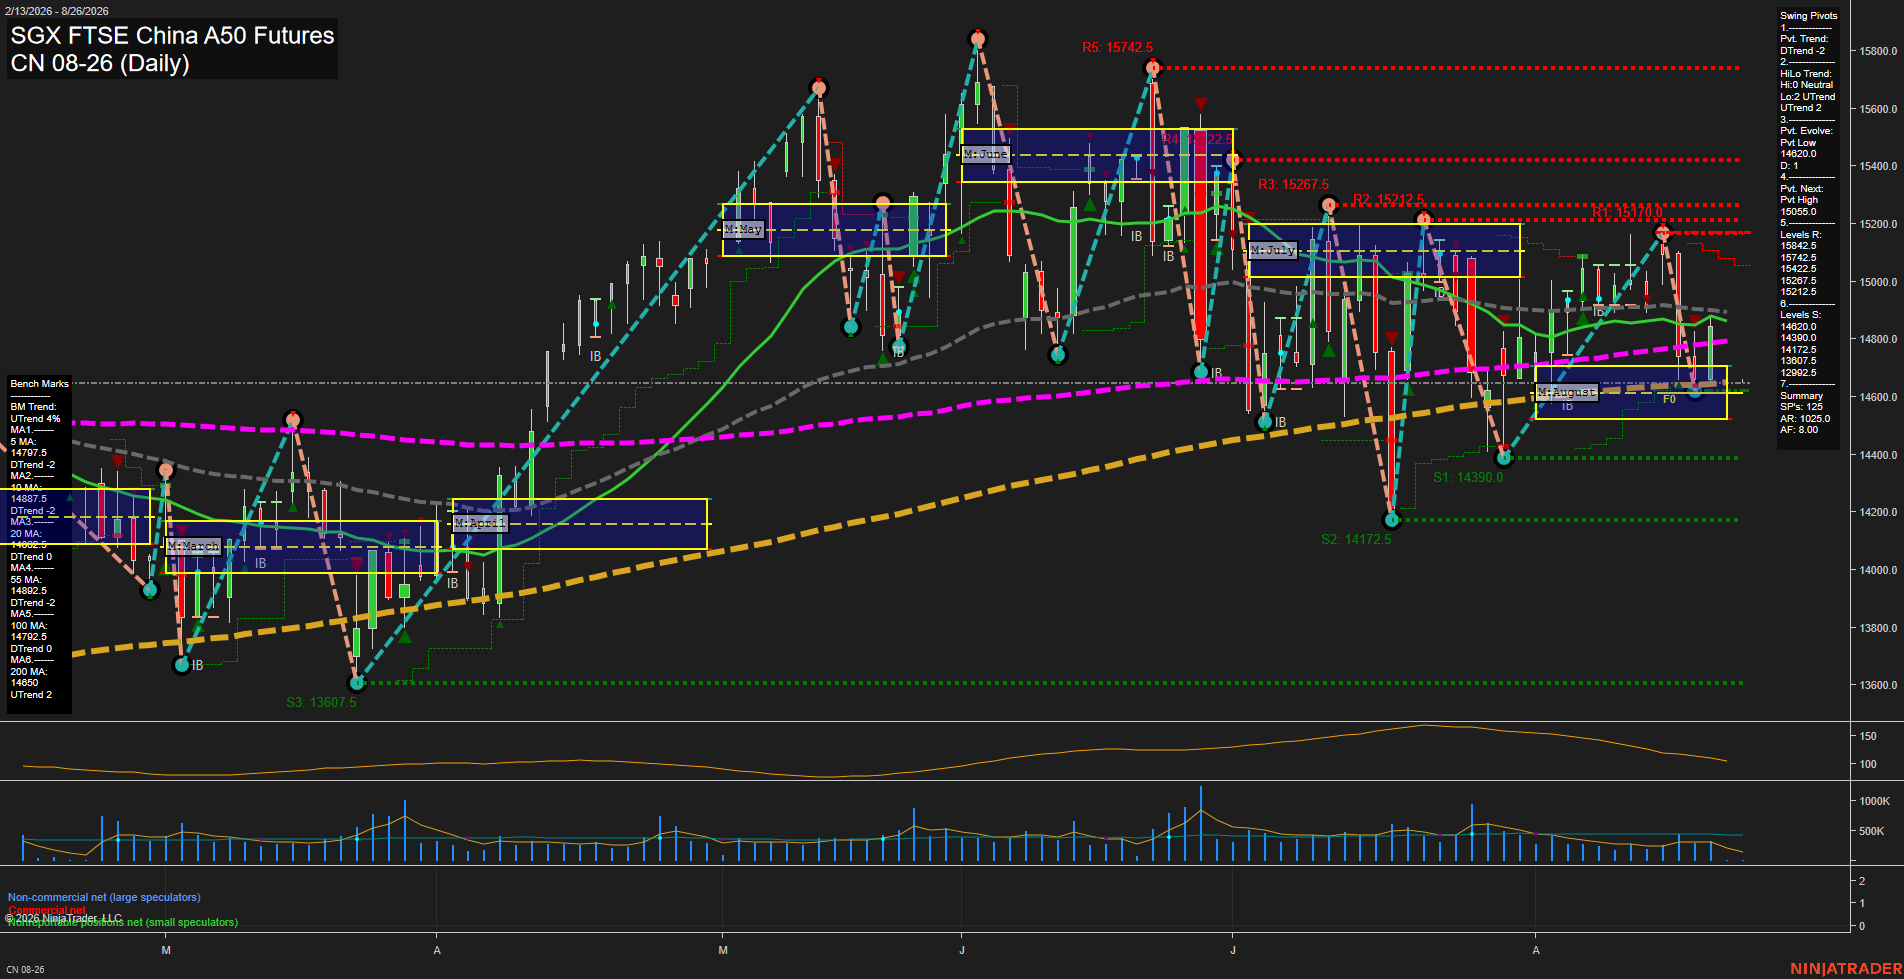
CN SGX FTSE China A50 Futures Daily Chart Analysis: 2026-Aug-24 07:02 CT
Price Action
- Last: 14620.0,
- Bars: Medium,
- Mom: Slow.
WSFG Weekly
- Short-Term
- WSFG Current: NA%
- F0%/NTZ' Bias: Price Neutral,
- WSFG Trend: Neutral.
MSFG Month Aug
- Intermediate-Term
- MSFG Current: 0%
- F0%/NTZ' Bias: Price Neutral,
- MSFG Trend: Neutral.
YSFG Year 2026
- Long-Term
- YSFG Current: NA%
- F0%/NTZ' Bias: Price Neutral,
- YSFG Trend: Neutral.
Swing Pivots
- (Short-Term) 1. Pvt. Trend: DTrend,
- (Intermediate-Term) 2. HiLo Trend: Neutral,
- 3. Pvt. Evolve: Pvt low 14620.0,
- 4. Pvt. Next: Pvt high 15055.0,
- 5. Levels R: 15842.5, 15742.5, 15422.5, 15267.5, 15212.5,
- 6. Levels S: 14620.0, 14390.0, 14172.5, 13607.5.
Daily Benchmarks
- (Short-Term) 5 Day: 14797.5 Up Trend,
- (Short-Term) 10 Day: 14887.5 Down Trend,
- (Intermediate-Term) 20 Day: 14882.5 Down Trend,
- (Intermediate-Term) 55 Day: 14892.5 Down Trend,
- (Long-Term) 100 Day: 14792.5 Down Trend,
- (Long-Term) 200 Day: 14650.0 Up Trend.
Additional Metrics
Overall Rating
- Short-Term: Bearish,
- Intermediate-Term: Bearish,
- Long-Term: Neutral.
Key Insights Summary
Price has retraced sharply from the recent 15212.5 pivot-high area and is testing the active 14620.0 pivot-low/F0% zone. The short-term pivot structure is bearish, with price beneath the 5, 10, 20, 55, and 100 day benchmarks, while declining ATR and lighter volume indicate slower momentum following the selloff. Intermediate structure remains mixed-to-bearish as the HiLo trend is neutral but the 20 and 55 day averages slope lower. The 200 day benchmark remains rising near price, creating a major long-term balance area; 14390.0 and 14172.5 are the next lower pivot supports, while 15055.0 is the pivot reversal level and 15212.5 is the nearest overhead swing resistance.
Chart Analysis ATS AI Generated: 2026-08-24 07:03 for Informational use only, not trading advice. Terms and Risk Disclosure Copyright © 2026. Algo Trading Systems LLC.