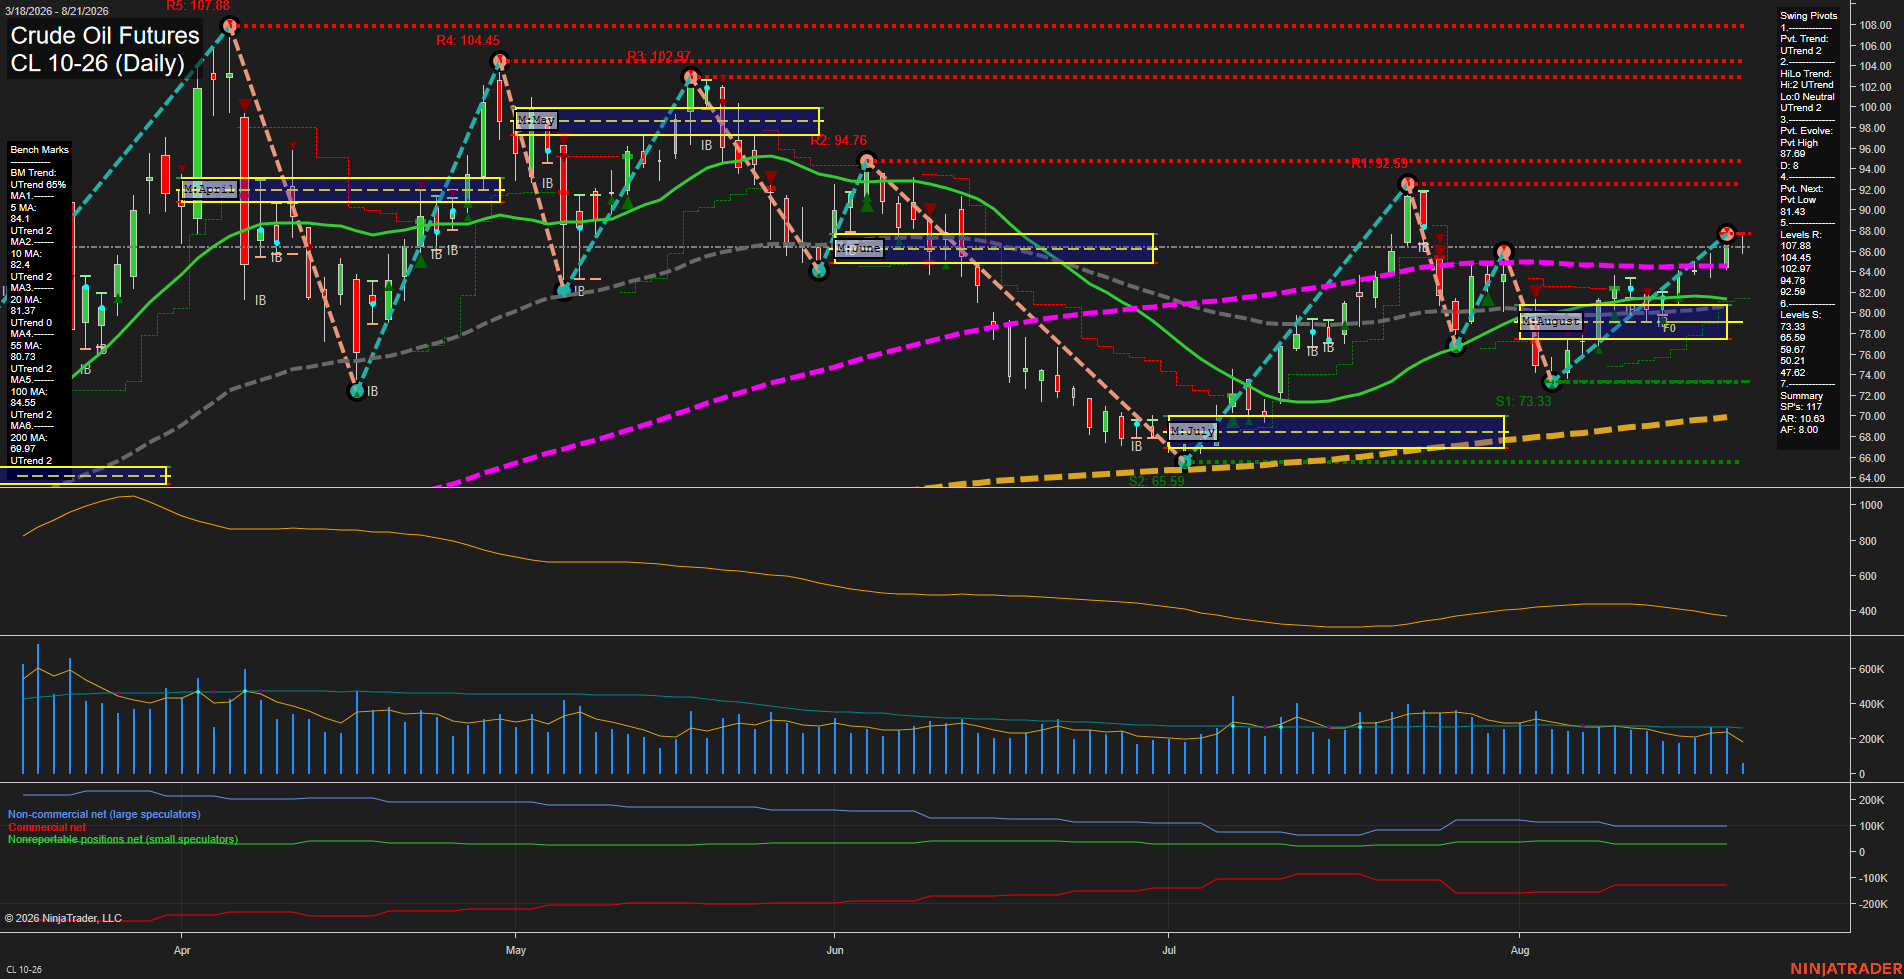
CL Crude Oil Futures Daily Chart Analysis: 2026-Aug-21 07:02 CT
Price Action
- Last: 87.00,
- Bars: Medium,
- Mom: fast.
WSFG Weekly
- Short-Term
- WSFG Current: 66%
- F0%/NTZ' Bias: Price Above,
- WSFG Trend: Up.
MSFG Month Aug
- Intermediate-Term
- MSFG Current: 33%
- F0%/NTZ' Bias: Price Above,
- MSFG Trend: Up.
YSFG Year 2026
- Long-Term
- YSFG Current: 125%
- F0%/NTZ' Bias: Price Above,
- YSFG Trend: Up.
Swing Pivots
- (Short-Term) 1. Pvt. Trend: UTrend,
- (Intermediate-Term) 2. HiLo Trend: UTrend,
- 3. Pvt. Evolve: Pvt high 87.69,
- 4. Pvt. Next: Pvt low 81.43,
- 5. Levels R: 107.88, 104.45, 102.97, 94.76, 92.59,
- 6. Levels S: 73.33, 65.59, 59.67, 50.21, 47.62.
Daily Benchmarks
- (Short-Term) 5 Day: 84.10 Up Trend,
- (Short-Term) 10 Day: 82.40 Up Trend,
- (Intermediate-Term) 20 Day: 81.37 Up Trend,
- (Intermediate-Term) 55 Day: 80.73 Up Trend,
- (Long-Term) 100 Day: 84.55 Up Trend,
- (Long-Term) 200 Day: 69.97 Up Trend.
Additional Metrics
- ATR: 10.63,
- VOLMA: 345883.
Recent Trade Signals
- 20 Aug 2026: Long CL 10-26 @ 84.55 Signals.USAR-MSFG
- 19 Aug 2026: Long CL 10-26 @ 85.23 Signals.USAR.TR720
- 18 Aug 2026: Long CL 09-26 @ 84.93 Signals.USAR.TR120
- 17 Aug 2026: Long CL 10-26 @ 83.96 Signals.USAR-WSFG
Overall Rating
- Short-Term: Bullish,
- Intermediate-Term: Bullish,
- Long-Term: Bullish.
Key Insights Summary
CL has extended its August rebound into a fast, medium-range upswing, with price at 87.00 holding above every daily benchmark and above the weekly and monthly fib-grid centers. Both pivot structures are UTrend, confirming higher-low behavior from the late-July low near 73.33. The current pivot is evolving as a high at 87.69, making that area the immediate swing inflection, while 81.43 defines the next indicated downside pivot threshold. The 92.59 to 94.76 resistance band is the next major overhead structure; below, the 5-day through 55-day averages clustered from 80.73 to 84.10 provide a technically constructive retracement zone. Long-term structure remains positive with price above the rising 100-day and 200-day benchmarks, while ATR near 10.63 reflects an actively volatile crude-oil swing environment.
Chart Analysis ATS AI Generated: 2026-08-21 07:02 for Informational use only, not trading advice. Terms and Risk Disclosure Copyright © 2026. Algo Trading Systems LLC.