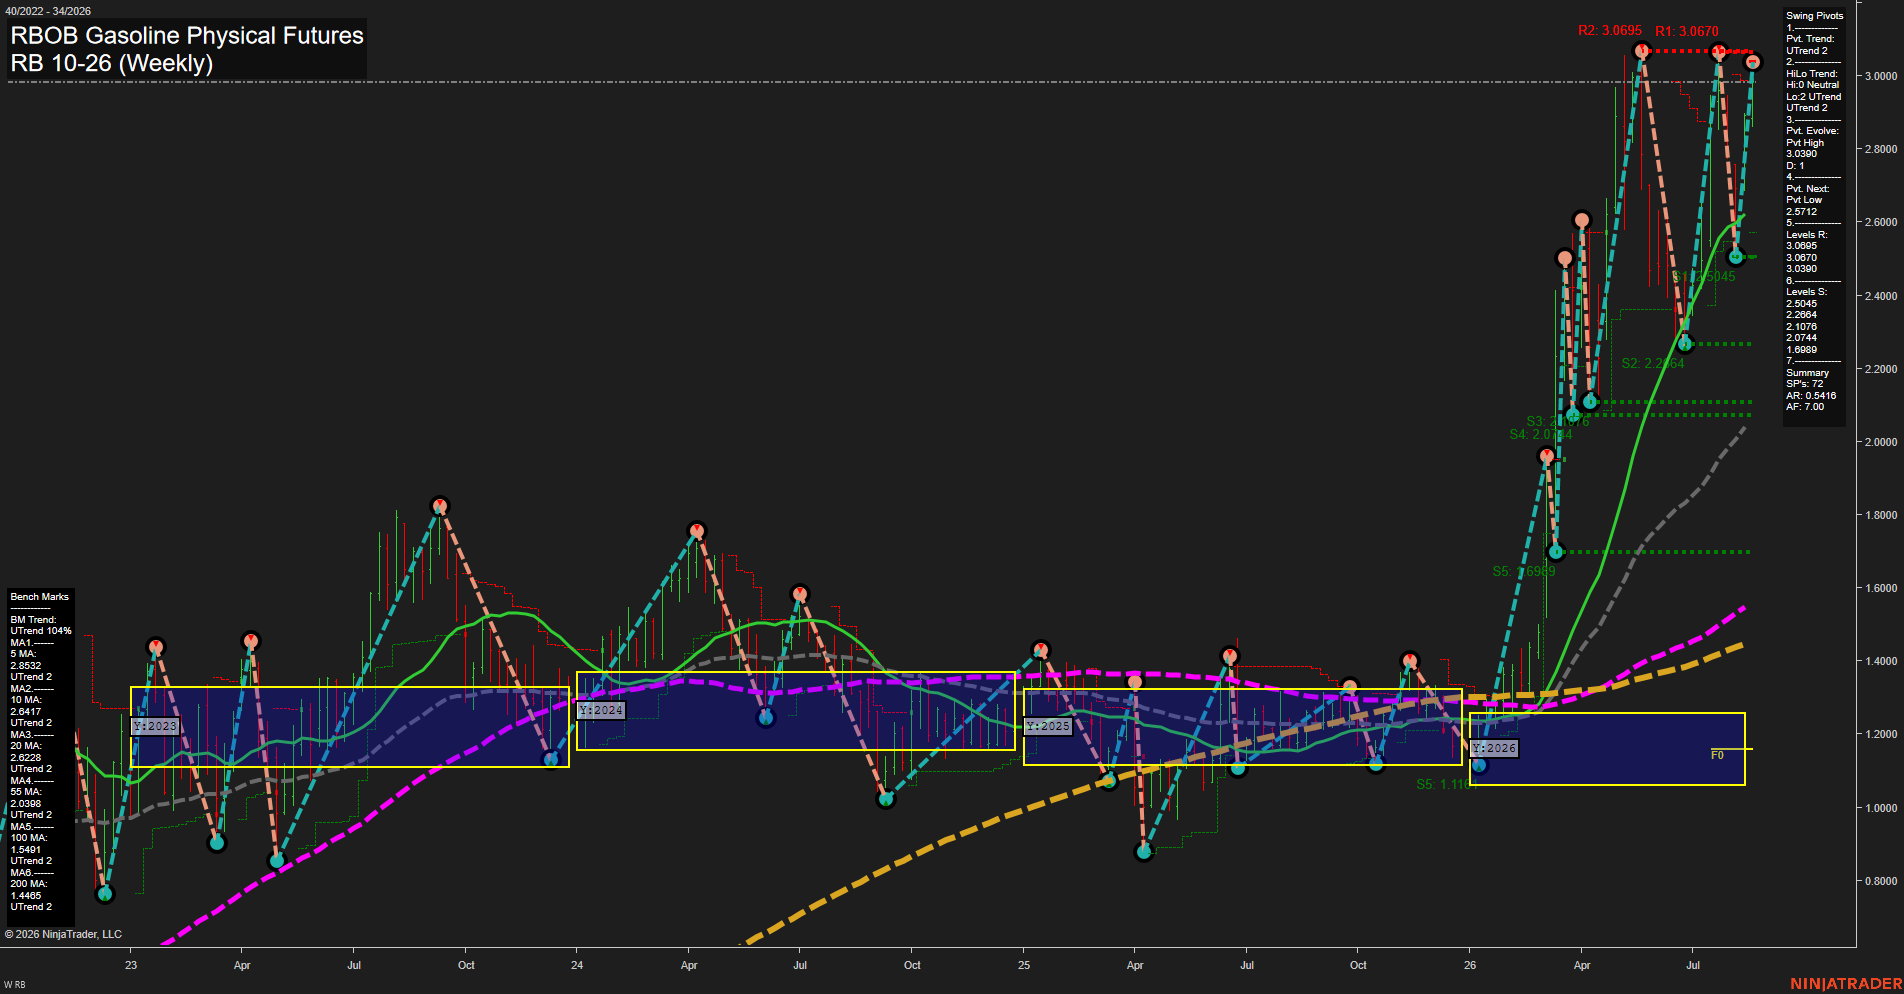
RB RBOB Gasoline Physical Futures Weekly Chart Analysis: 2026-Aug-20 07:08 CT
Price Action
- Last: 3.0390,
- Bars: Medium,
- Mom: fast.
WSFG Weekly
- Short-Term
- WSFG Current: 49%
- F0%/NTZ' Bias: Price Above,
- WSFG Trend: Up.
MSFG Month Aug
- Intermediate-Term
- MSFG Current: 40%
- F0%/NTZ' Bias: Price Above,
- MSFG Trend: Up.
YSFG Year 2026
- Long-Term
- YSFG Current: 184%
- F0%/NTZ' Bias: Price Above,
- YSFG Trend: Up.
Swing Pivots
- (Short-Term) 1. Pvt. Trend: UTrend,
- (Intermediate-Term) 2. HiLo Trend: UTrend,
- 3. Pvt. Evolve: Pvt high 3.0390,
- 4. Pvt. Next: Pvt low 2.5712,
- 5. Levels R: 3.0695, 3.0670, 3.0390,
- 6. Levels S: 2.5045, 2.2864, 2.1078, 2.0744, 1.6889.
Weekly Benchmarks
- (Short-Term) 5 Day: 2.8582 Up Trend,
- (Short-Term) 10 Day: 2.6417 Up Trend,
- (Intermediate-Term) 20 Day: 2.6228 Up Trend,
- (Intermediate-Term) 55 Day: 2.0308 Up Trend,
- (Long-Term) 100 Day: 1.5491 Up Trend,
- (Long-Term) 200 Day: 1.4485 Up Trend.
Recent Trade Signals
- 17 Aug 2026: Long RB 09-26 @ 3.2108 Signals.USAR-WSFG
- 17 Aug 2026: Long RB 09-26 @ 3.1706 Signals.USAR-MSFG
Overall Rating
- Short-Term: Bullish,
- Intermediate-Term: Bullish,
- Long-Term: Bullish.
Key Insights Summary
RB remains in a powerful weekly upside cycle, with price holding well above the yearly NTZ and every benchmark average rising. The advance has been fast and volatile, producing higher swing lows while repeatedly testing the 3.0390 to 3.0695 resistance band. The current evolving pivot is a high, making this area a near-term consolidation and rejection point, while 2.5712 defines the next key pivot-reversal level. The weekly, monthly, and yearly Fib-grid structure remains aligned upward, reflecting broad trend continuation despite the frothy late-stage price action.
Chart Analysis ATS AI Generated: 2026-08-20 07:09 for Informational use only, not trading advice. Terms and Risk Disclosure Copyright © 2026. Algo Trading Systems LLC.