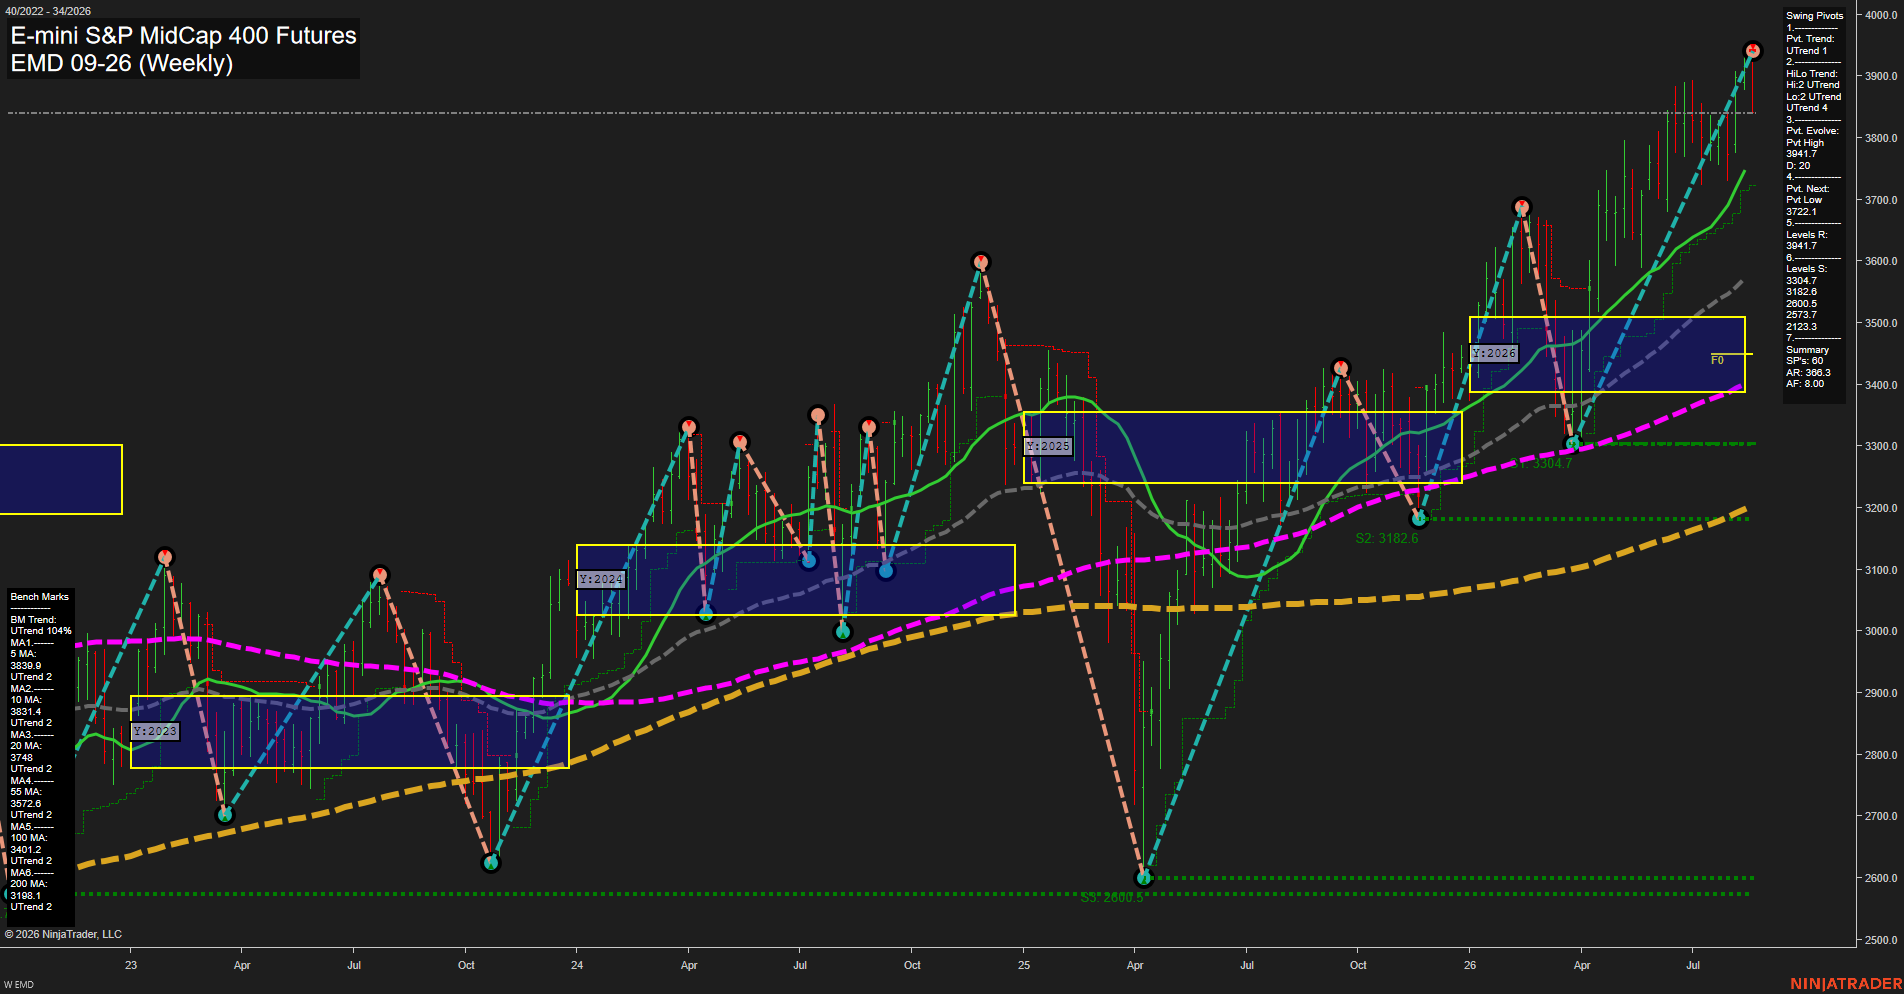
EMD E-mini S&P MidCap 400 Futures Weekly Chart Analysis: 2026-Aug-20 07:03 CT
Price Action
- Last: 3886.3,
- Bars: Medium,
- Mom: Fast.
WSFG Weekly
- Short-Term
- WSFG Current: -107%
- F0%/NTZ' Bias: Price Below,
- WSFG Trend: Down.
MSFG Month Aug
- Intermediate-Term
- MSFG Current: 27%
- F0%/NTZ' Bias: Price Above,
- MSFG Trend: Up.
YSFG Year 2026
- Long-Term
- YSFG Current: 64%
- F0%/NTZ' Bias: Price Above,
- YSFG Trend: Up.
Swing Pivots
- (Short-Term) 1. Pvt. Trend: UTrend,
- (Intermediate-Term) 2. HiLo Trend: UTrend,
- 3. Pvt. Evolve: Pvt high 3941.7,
- 4. Pvt. Next: Pvt low 3722.1,
- 5. Levels R: 3941.7,
- 6. Levels S: 3804.7, 3182.6, 2800.5, 2597.7, 2123.3.
Weekly Benchmarks
- (Short-Term) 5 Day: 3838.9 Up Trend,
- (Short-Term) 10 Day: 3831.4 Up Trend,
- (Intermediate-Term) 20 Day: 3748.9 Up Trend,
- (Intermediate-Term) 55 Day: 3572.6 Up Trend,
- (Long-Term) 100 Day: 3401.2 Up Trend,
- (Long-Term) 200 Day: 3198.1 Up Trend.
Recent Trade Signals
- 18 Aug 2026: Short EMD 09-26 @ 3914.8 Signals.USAR.TR120
- 12 Aug 2026: Long EMD 09-26 @ 3906 Signals.USAR-WSFG
Overall Rating
- Short-Term: Neutral,
- Intermediate-Term: Bullish,
- Long-Term: Bullish.
Key Insights Summary
The weekly structure remains broadly constructive, with both pivot trends rising and price materially above all rising benchmark averages. The recent advance reached 3941.7 resistance and has produced a fast, medium-range pullback toward 3886.3, while the weekly fib-grid reading has turned down below its NTZ. This creates a short-term countertrend consolidation within an intermediate- and long-term uptrend. The 3941.7 pivot high defines the immediate overhead ceiling, while 3804.7 is the closest structural support; a sustained higher-low pattern remains intact above that level.
Chart Analysis ATS AI Generated: 2026-08-20 07:04 for Informational use only, not trading advice. Terms and Risk Disclosure Copyright © 2026. Algo Trading Systems LLC.