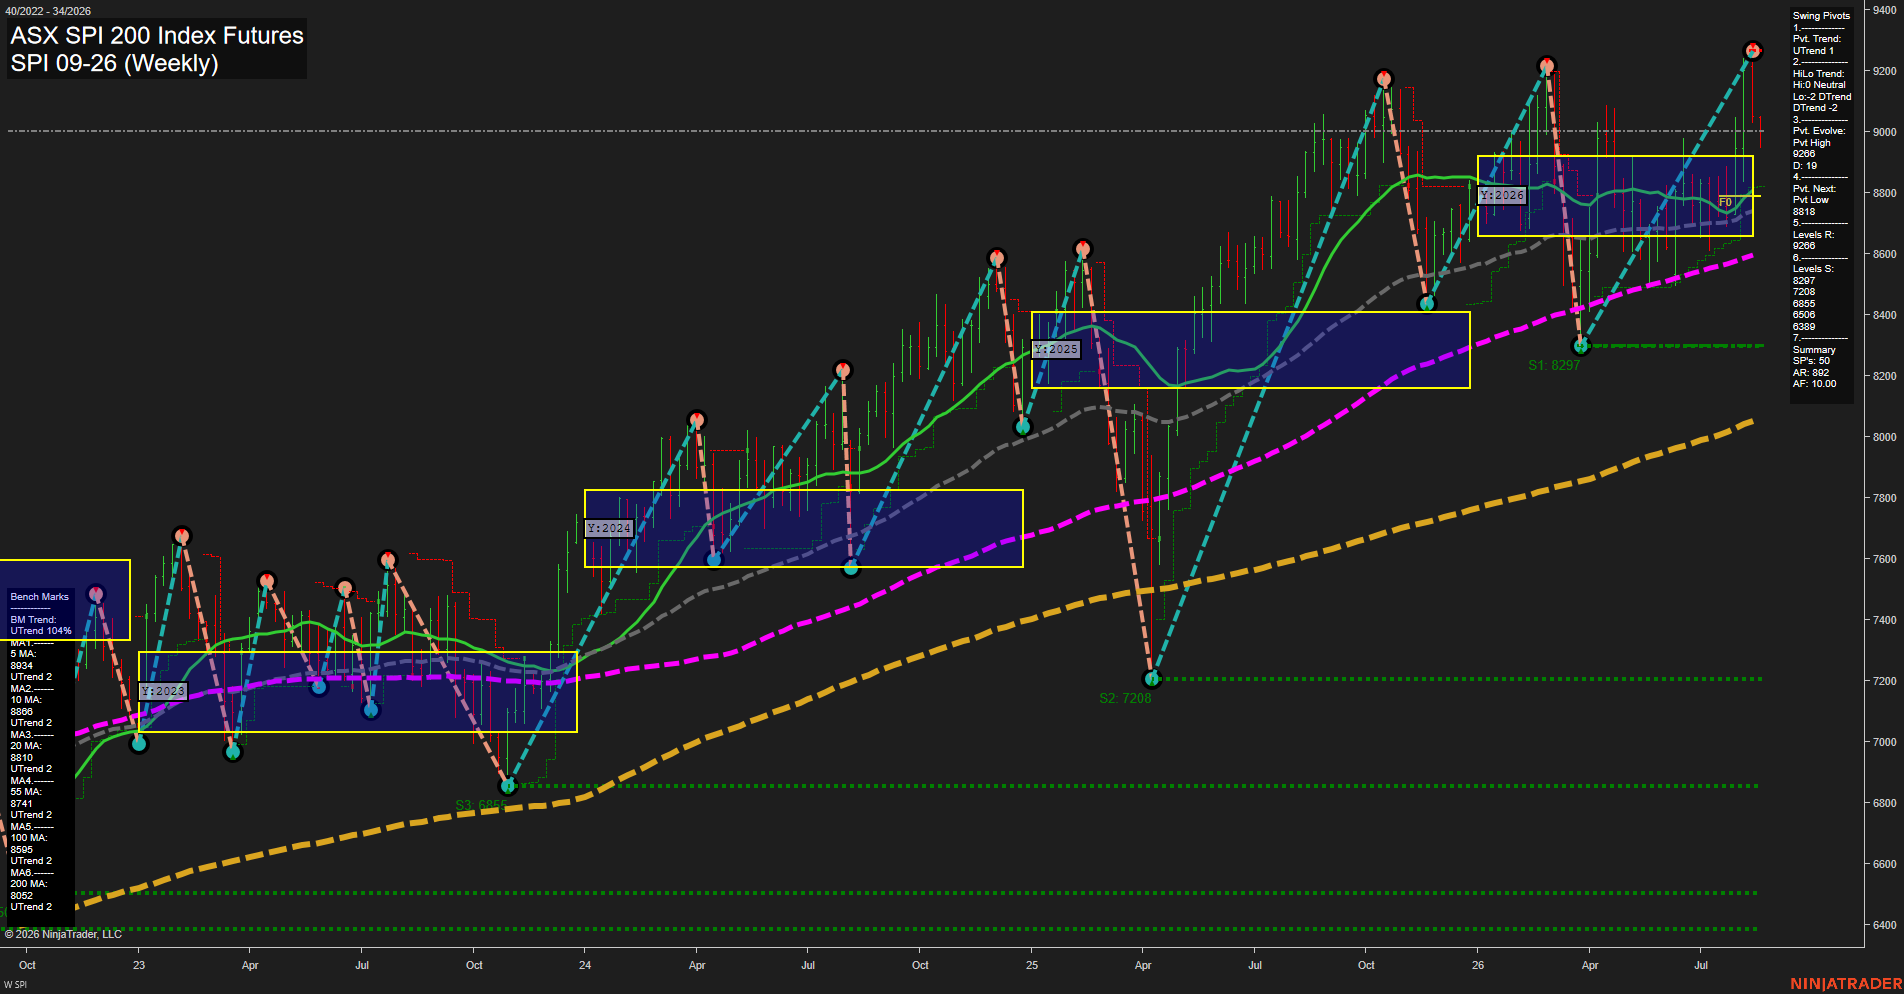
SPI ASX SPI 200 Index Futures Weekly Chart Analysis: 2026-Aug-19 07:09 CT
Price Action
- Last: 9000,
- Bars: Large,
- Mom: fast.
WSFG Weekly
- Short-Term
- WSFG Current: NA%
- F0%/NTZ' Bias: Price Neutral,
- WSFG Trend: Neutral.
MSFG Month Aug
- Intermediate-Term
- MSFG Current: NA%
- F0%/NTZ' Bias: Price Neutral,
- MSFG Trend: Neutral.
YSFG Year 2026
- Long-Term
- YSFG Current: NA%
- F0%/NTZ' Bias: Price Bullish,
- YSFG Trend: Bullish.
Swing Pivots
- (Short-Term) 1. Pvt. Trend: UTrend,
- (Intermediate-Term) 2. HiLo Trend: Neutral,
- 3. Pvt. Evolve: Pvt high 9266,
- 4. Pvt. Next: Pvt low 8818,
- 5. Levels R: 9266,
- 6. Levels S: 8297, 7208, 6855, 6506, 6339.
Weekly Benchmarks
- (Short-Term) 5 Day: 9344 Up Trend,
- (Short-Term) 10 Day: 8860 Up Trend,
- (Intermediate-Term) 20 Day: 8410 Up Trend,
- (Intermediate-Term) 55 Day: 8741 Up Trend,
- (Long-Term) 100 Day: 8595 Up Trend,
- (Long-Term) 200 Day: 8052 Up Trend.
Overall Rating
- Short-Term: Bullish,
- Intermediate-Term: Bullish,
- Long-Term: Bullish.
Key Insights Summary
The weekly structure remains broadly constructive: price is above the rising 10, 20, 55, 100, and 200-period benchmarks, while the pivot sequence retains a short-term UTrend. The latest advance reached and rejected from the 9266 pivot-high resistance, producing large-range, fast-momentum price action and a near-term pullback toward the 8818 reversal level. The intermediate pivot structure is neutral rather than fully trending, reflecting consolidation beneath the recent high, but the yearly grid position and rising long-term averages continue to define an underlying bullish major trend.
Chart Analysis ATS AI Generated: 2026-08-19 07:10 for Informational use only, not trading advice. Terms and Risk Disclosure Copyright © 2026. Algo Trading Systems LLC.