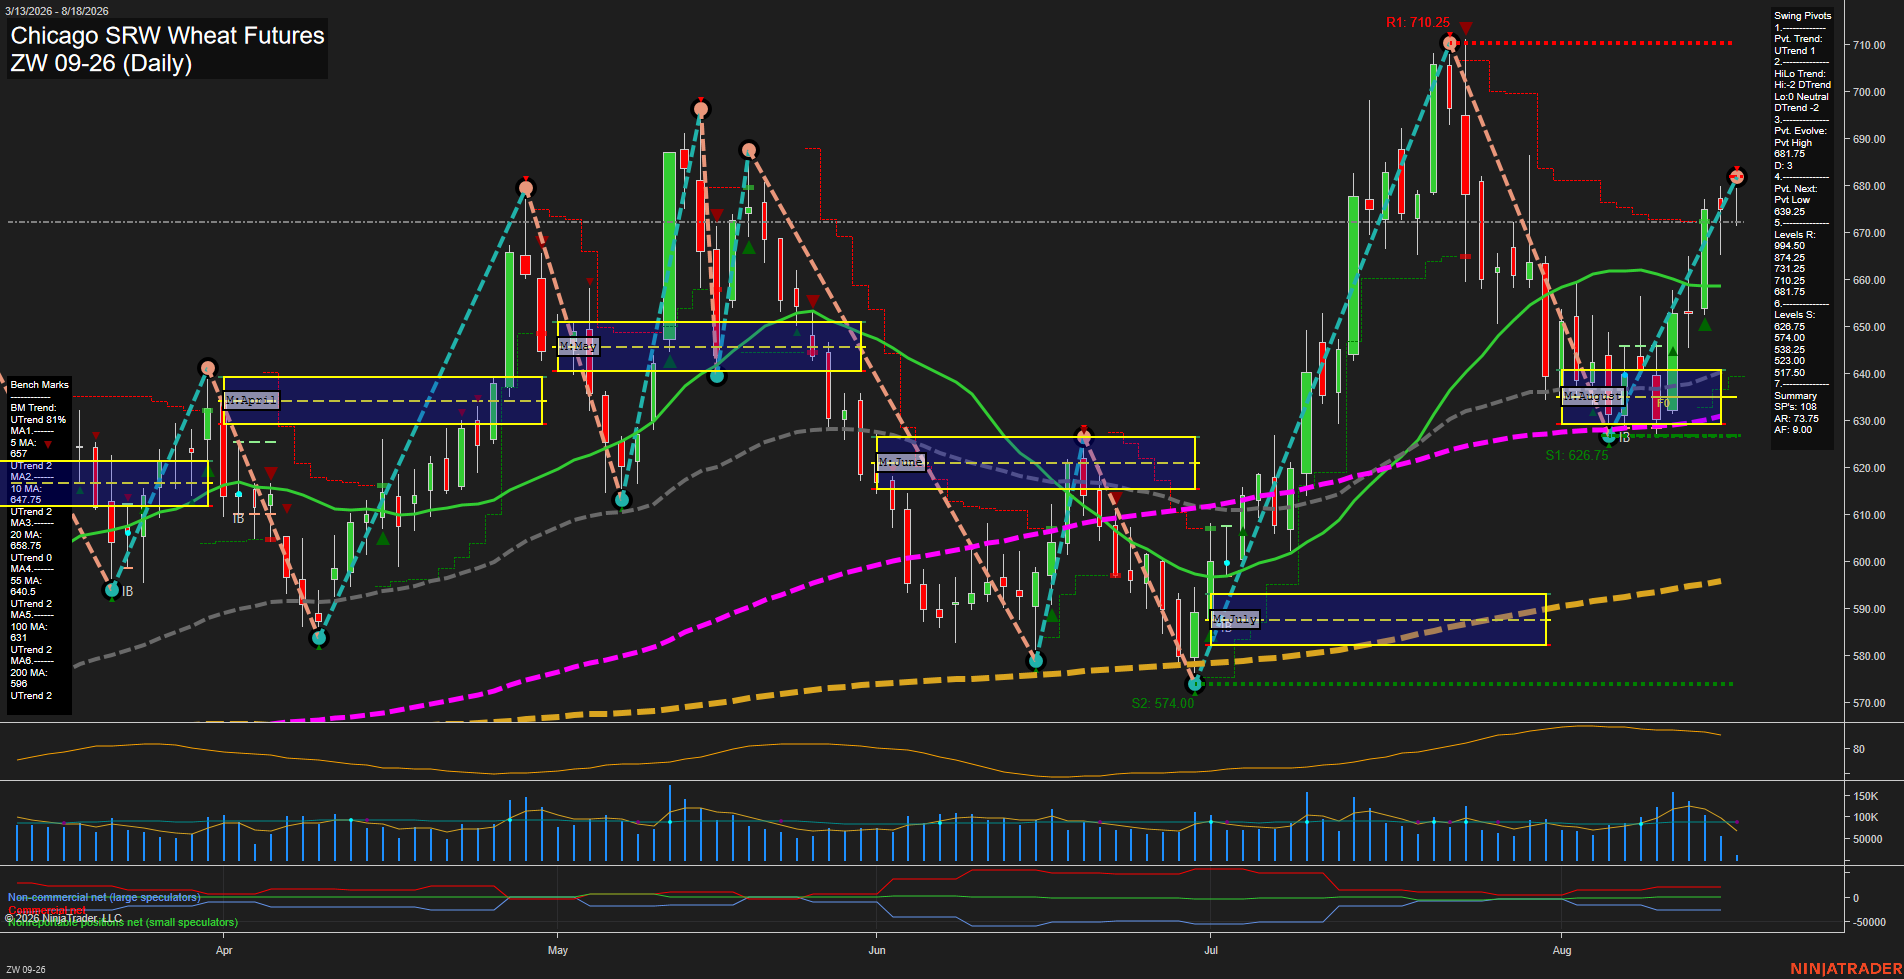
ZW Chicago SRW Wheat Futures Daily Chart Analysis: 2026-Aug-18 07:13 CT
Price Action
- Last: 671.25,
- Bars: Medium,
- Mom: fast.
WSFG Weekly
- Short-Term
- WSFG Current: -9%
- F0%/NTZ' Bias: Price Below,
- WSFG Trend: Down.
MSFG Month Aug
- Intermediate-Term
- MSFG Current: 46%
- F0%/NTZ' Bias: Price Above,
- MSFG Trend: Up.
YSFG Year 2026
- Long-Term
- YSFG Current: 58%
- F0%/NTZ' Bias: Price Above,
- YSFG Trend: Up.
Swing Pivots
- (Short-Term) 1. Pvt. Trend: UTrend,
- (Intermediate-Term) 2. HiLo Trend: DTrend,
- 3. Pvt. Evolve: Pvt high 681,
- 4. Pvt. Next: Pvt low 639.25,
- 5. Levels R: 710.25, 694.00, 681.75, 674.25, 631.25,
- 6. Levels S: 626.75, 574.00, 538.25, 523.00, 517.50.
Daily Benchmarks
- (Short-Term) 5 Day: 657 Up Trend,
- (Short-Term) 10 Day: 647.75 Up Trend,
- (Intermediate-Term) 20 Day: 658.75 Up Trend,
- (Intermediate-Term) 55 Day: 640.50 Up Trend,
- (Long-Term) 100 Day: 631 Up Trend,
- (Long-Term) 200 Day: 596 Up Trend.
Additional Metrics
- ATR: 73.75,
- VOLMA: 77996.
Recent Trade Signals
- 13 Aug 2026: Long ZW 09-26 @ 653.75 Signals.USAR-WSFG
- 12 Aug 2026: Long ZW 09-26 @ 650.5 Signals.USAR-MSFG
- 12 Aug 2026: Long ZW 09-26 @ 650 Signals.USAR.TR120
Overall Rating
- Short-Term: Bullish,
- Intermediate-Term: Bullish,
- Long-Term: Bullish.
Key Insights Summary
ZW has recovered sharply from the early-August pullback and is trading above all six rising benchmark averages. The short-term pivot sequence is positive, with fast upside momentum and price holding above the August monthly F0% zone, while the weekly grid remains marginally below its F0% reference and reflects an incomplete short-term recovery. The intermediate HiLo pivot structure remains DTrend, making the 681.75 to 694.00 resistance band important in defining whether the rally evolves into a broader higher-high continuation. Longer-term structure remains constructive: price is above the rising 100-day and 200-day averages, the yearly grid is positive, and the rally has rebuilt from the July low through higher lows. ATR near 73.75 reflects an active daily range environment, while volume is near its moving-average range rather than displaying an extreme expansion.
Chart Analysis ATS AI Generated: 2026-08-18 07:13 for Informational use only, not trading advice. Terms and Risk Disclosure Copyright © 2026. Algo Trading Systems LLC.