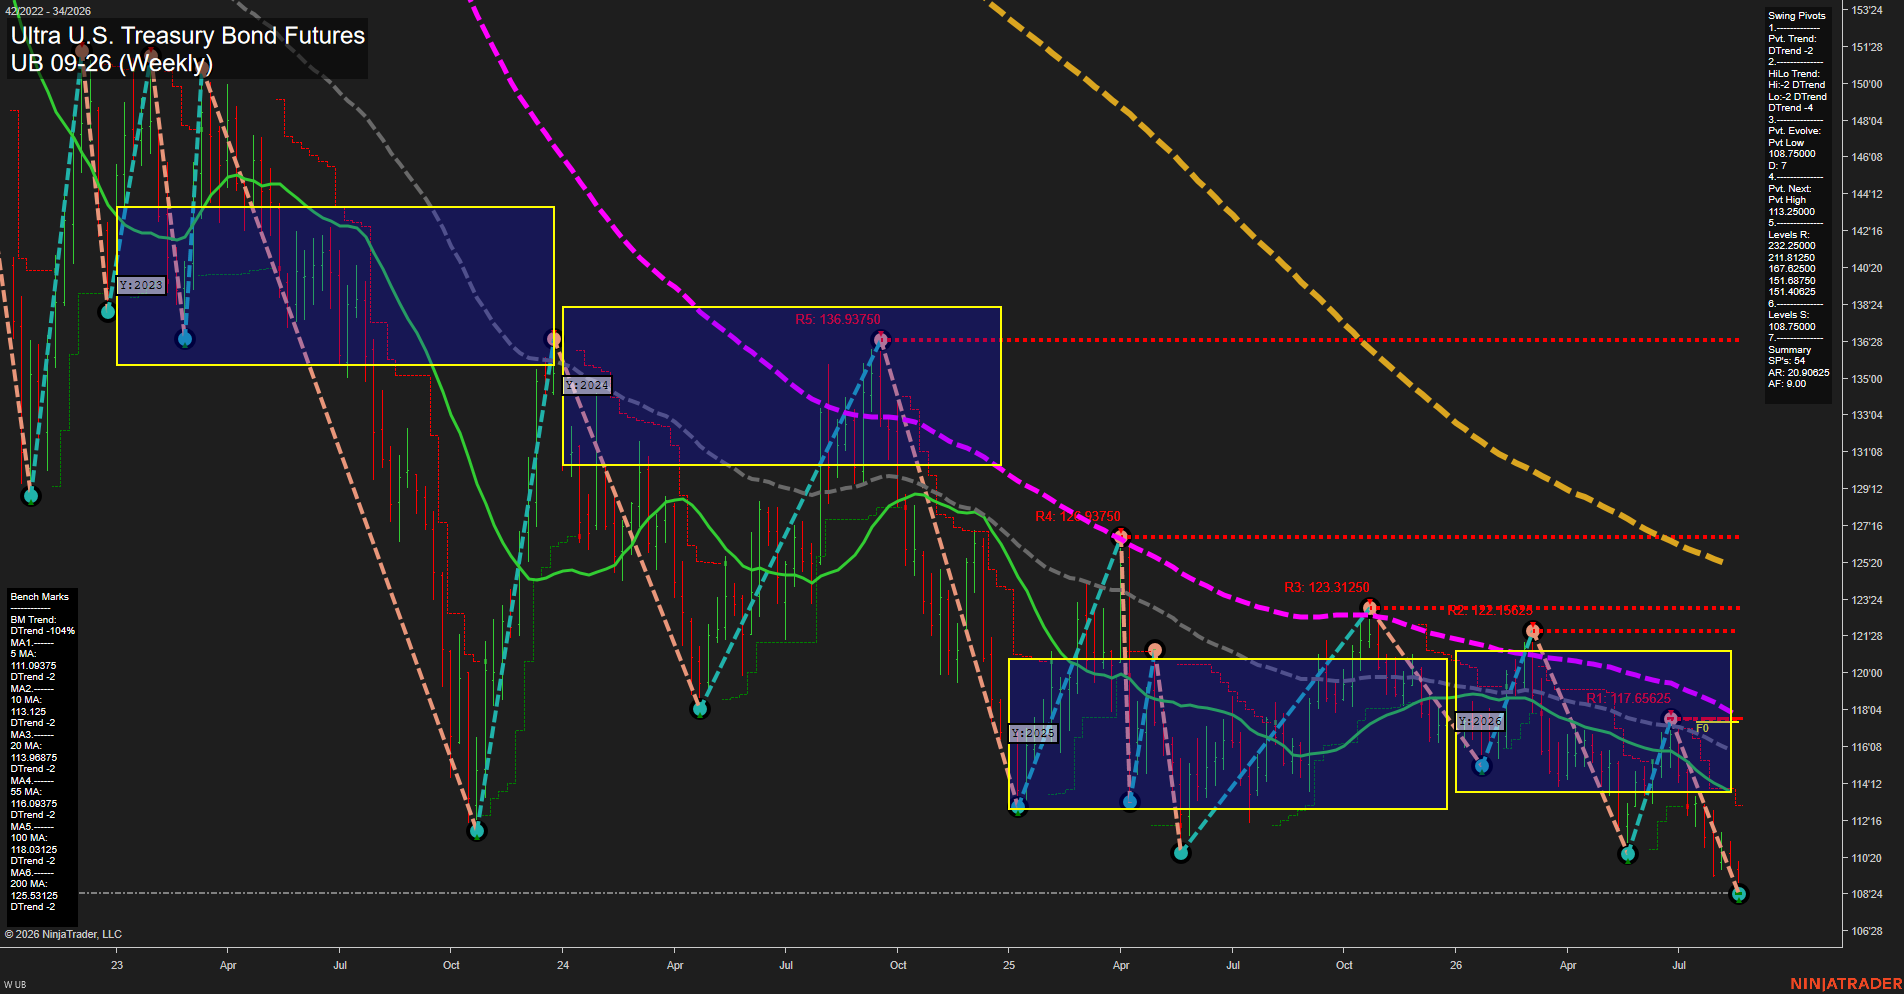
UB Ultra U.S. Treasury Bond Futures Weekly Chart Analysis: 2026-Aug-18 07:10 CT
Price Action
- Last: 108.75000,
- Bars: Medium,
- Mom: Fast.
WSFG Weekly
- Short-Term
- WSFG Current: -51%
- F0%/NTZ' Bias: Price Below,
- WSFG Trend: Down.
MSFG Month Aug
- Intermediate-Term
- MSFG Current: -34%
- F0%/NTZ' Bias: Price Below,
- MSFG Trend: Down.
YSFG Year 2026
- Long-Term
- YSFG Current: -24%
- F0%/NTZ' Bias: Price Below,
- YSFG Trend: Down.
Swing Pivots
- (Short-Term) 1. Pvt. Trend: DTrend,
- (Intermediate-Term) 2. HiLo Trend: DTrend,
- 3. Pvt. Evolve: Pvt low 108.75000,
- 4. Pvt. Next: Pvt high 113.25000,
- 5. Levels R: 123.25000, 121.81250, 117.62500, 115.68750, 115.40825,
- 6. Levels S: 108.75000.
Weekly Benchmarks
- (Short-Term) 5 Day: 111.09375 Down Trend,
- (Short-Term) 10 Day: 113.12500 Down Trend,
- (Intermediate-Term) 20 Day: 113.96875 Down Trend,
- (Intermediate-Term) 55 Day: 116.09375 Down Trend,
- (Long-Term) 100 Day: 118.03125 Down Trend,
- (Long-Term) 200 Day: 125.53125 Down Trend.
Recent Trade Signals
- 17 Aug 2026: Short UB 09-26 @ 109.6875 Signals.USAR-MSFG
- 17 Aug 2026: Short UB 09-26 @ 109.625 Signals.USAR-WSFG
- 14 Aug 2026: Short UB 09-26 @ 109.9375 Signals.USAR.TR120
Overall Rating
- Short-Term: Bearish,
- Intermediate-Term: Bearish,
- Long-Term: Bearish.
Key Insights Summary
UB remains in a broad weekly selloff, with price extending beneath the Weekly, Monthly, and Yearly Fib-grid F0%/NTZ areas. Fast downside momentum, a developing pivot low at 108.75000, and bearish alignment across every benchmark confirm persistent lower-high and lower-low structure. The 113.25000 pivot-next level defines the nearest swing reversal threshold, while the clustered 115.40825 to 117.62500 resistance zone marks the first meaningful overhead retracement area within the established downtrend.
Chart Analysis ATS AI Generated: 2026-08-18 07:10 for Informational use only, not trading advice. Terms and Risk Disclosure Copyright © 2026. Algo Trading Systems LLC.