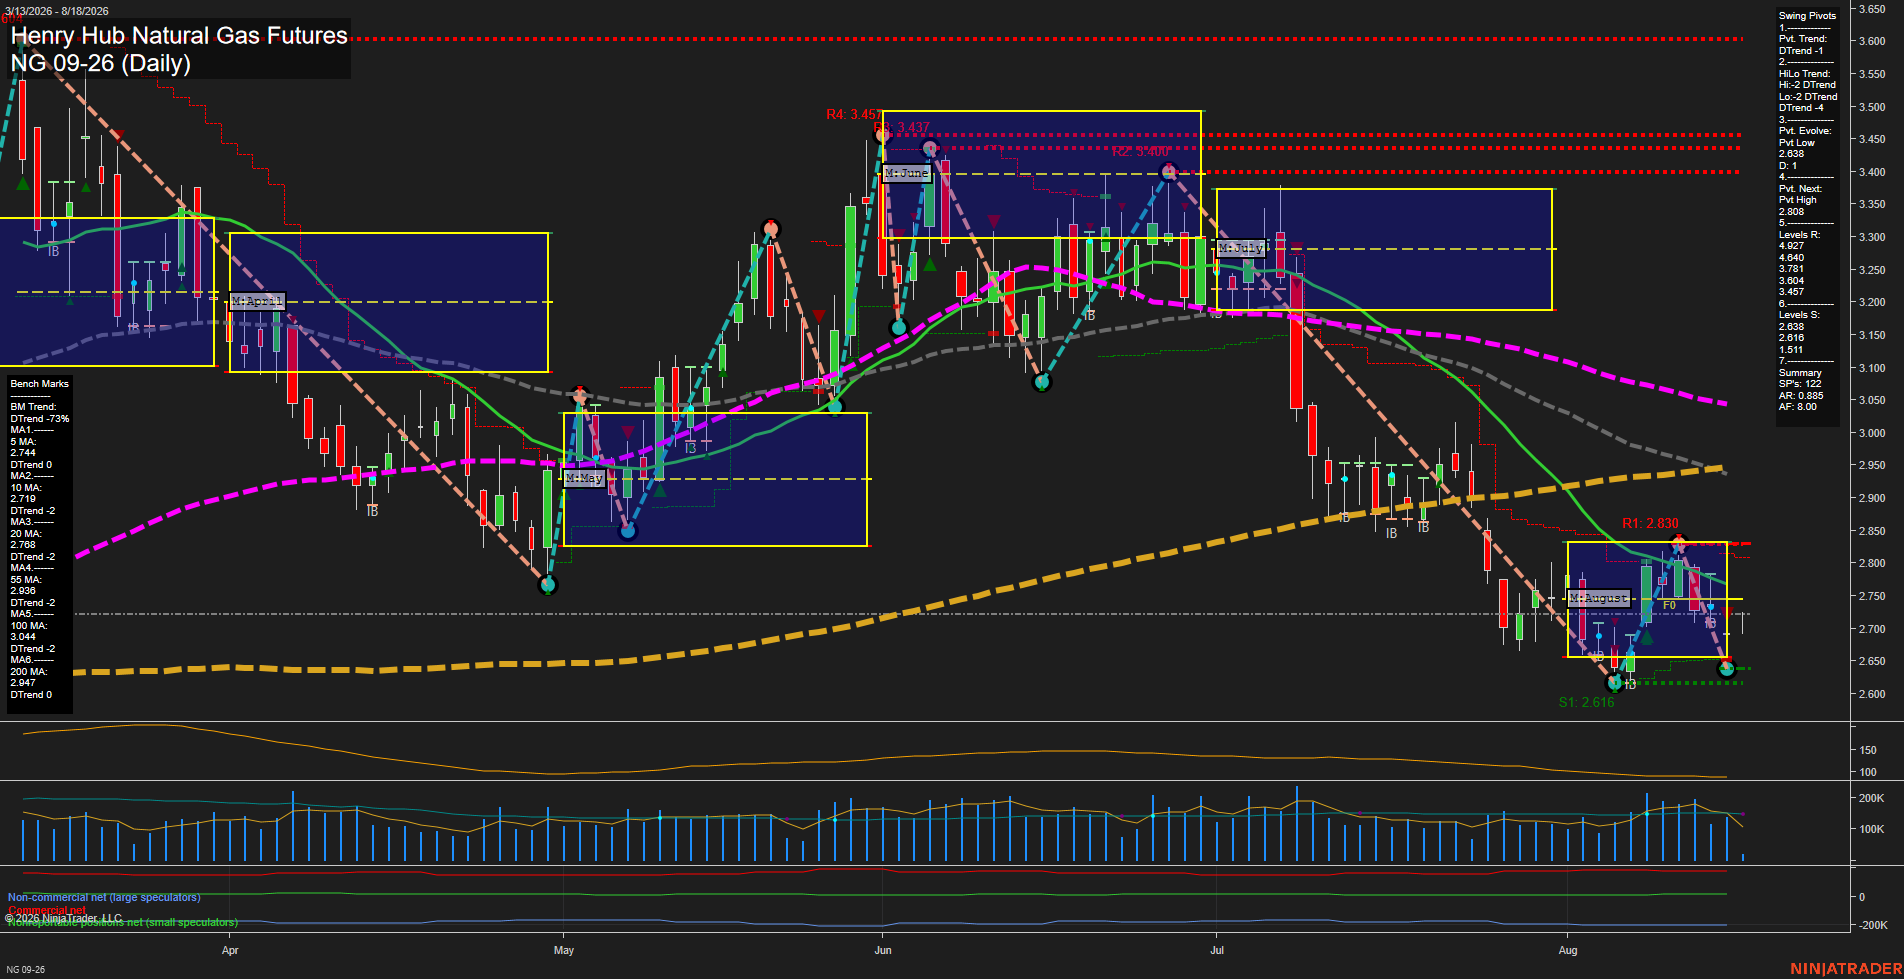
NG Henry Hub Natural Gas Futures Daily Chart Analysis: 2026-Aug-18 07:06 CT
Price Action
- Last: 2.719,
- Bars: Small,
- Mom: Slow.
WSFG Weekly
- Short-Term
- WSFG Current: 17%
- F0%/NTZ' Bias: Price Above,
- WSFG Trend: Up.
MSFG Month Aug
- Intermediate-Term
- MSFG Current: -5%
- F0%/NTZ' Bias: Price Below,
- MSFG Trend: Down.
YSFG Year 2026
- Long-Term
- YSFG Current: 10%
- F0%/NTZ' Bias: Price Above,
- YSFG Trend: Up.
Swing Pivots
- (Short-Term) 1. Pvt. Trend: DTrend,
- (Intermediate-Term) 2. HiLo Trend: DTrend,
- 3. Pvt. Evolve: Pvt low 2.638,
- 4. Pvt. Next: Pvt high 2.808,
- 5. Levels R: 4.940, 4.640, 3.781, 3.647, 3.457,
- 6. Levels S: 2.638, 2.616.
Daily Benchmarks
- (Short-Term) 5 Day: 2.744 Down Trend,
- (Short-Term) 10 Day: 2.719 Down Trend,
- (Intermediate-Term) 20 Day: 2.708 Down Trend,
- (Intermediate-Term) 55 Day: 2.936 Down Trend,
- (Long-Term) 100 Day: 3.044 Down Trend,
- (Long-Term) 200 Day: 2.947 Up Trend.
Additional Metrics
Recent Trade Signals
- 18 Aug 2026: Long NG 09-26 @ 2.719 Signals.USAR-WSFG
Overall Rating
- Short-Term: Bearish,
- Intermediate-Term: Bearish,
- Long-Term: Neutral.
Key Insights Summary
NG is consolidating near the August lows after a sharp July-to-August decline. Price is holding above the weekly F0% area and the 2.638 pivot low, but remains beneath the declining 5-, 10-, 55-, and 100-day benchmarks. The short-term pivot structure remains in DTrend, with 2.808 defining the next upside pivot reversal level. Intermediate structure is also bearish, reflecting lower highs and lower lows beneath the monthly grid. The yearly grid remains positive and the 200-day average is rising, creating a longer-term countertrend backdrop beneath the current bearish swing phase.
Chart Analysis ATS AI Generated: 2026-08-18 07:06 for Informational use only, not trading advice. Terms and Risk Disclosure Copyright © 2026. Algo Trading Systems LLC.