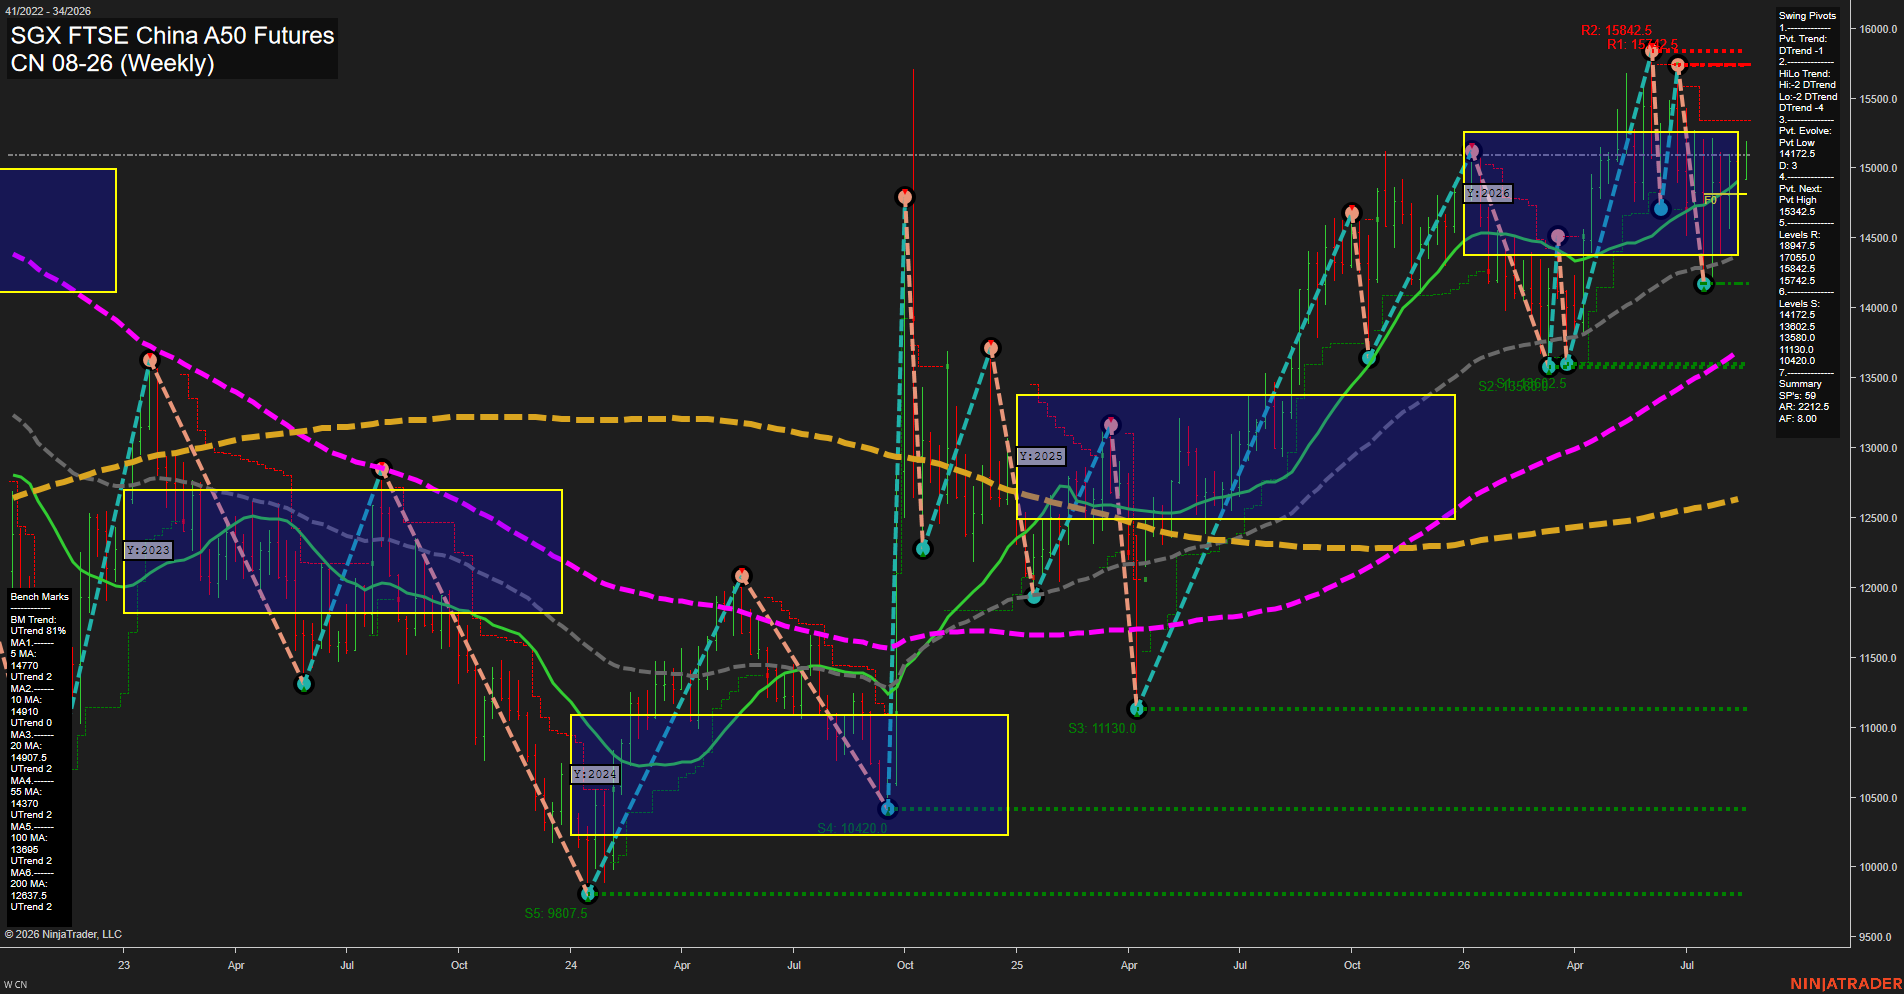
CN SGX FTSE China A50 Futures Weekly Chart Analysis: 2026-Aug-18 07:02 CT
Price Action
- Last: 15072.5,
- Bars: Large,
- Mom: fast.
WSFG Weekly
- Short-Term
- WSFG Current: NA%
- F0%/NTZ' Bias: Price Neutral,
- WSFG Trend: Neutral.
MSFG Month Aug
- Intermediate-Term
- MSFG Current: NA%
- F0%/NTZ' Bias: Price Neutral,
- MSFG Trend: Neutral.
YSFG Year 2026
- Long-Term
- YSFG Current: NA%
- F0%/NTZ' Bias: Price Neutral,
- YSFG Trend: Neutral.
Swing Pivots
- (Short-Term) 1. Pvt. Trend: DTrend,
- (Intermediate-Term) 2. HiLo Trend: DTrend,
- 3. Pvt. Evolve: Pvt low 14712.5,
- 4. Pvt. Next: Pvt high 15342.5,
- 5. Levels R: 18945.0, 17055.0, 15842.5,
- 6. Levels S: 14712.5, 13602.5, 13580.0, 11130.0.
Weekly Benchmarks
- (Short-Term) 5 Day: 14770.0 Up Trend,
- (Short-Term) 10 Day: 14910.0 Up Trend,
- (Intermediate-Term) 20 Day: 14907.5 Up Trend,
- (Intermediate-Term) 55 Day: 14370.0 Up Trend,
- (Long-Term) 100 Day: 13695.0 Down Trend,
- (Long-Term) 200 Day: 12637.5 Up Trend.
Overall Rating
- Short-Term: Neutral,
- Intermediate-Term: Neutral,
- Long-Term: Bullish.
Key Insights Summary
Price is rebounding sharply from the 14712.5 pivot low and has reclaimed the rising 5-, 10-, 20-, and 55-period benchmarks, but the active short-term pivot structure remains in DTrend until the 15342.5 reversal threshold is exceeded. The chart is volatile and rotational beneath the 15842.5 resistance zone, while 14712.5 is the nearest structural support. Long-term structure remains constructive because price is materially above the 100- and 200-period benchmarks, although the declining 100-period average reflects the prior multi-year corrective cycle.
Chart Analysis ATS AI Generated: 2026-08-18 07:03 for Informational use only, not trading advice. Terms and Risk Disclosure Copyright © 2026. Algo Trading Systems LLC.