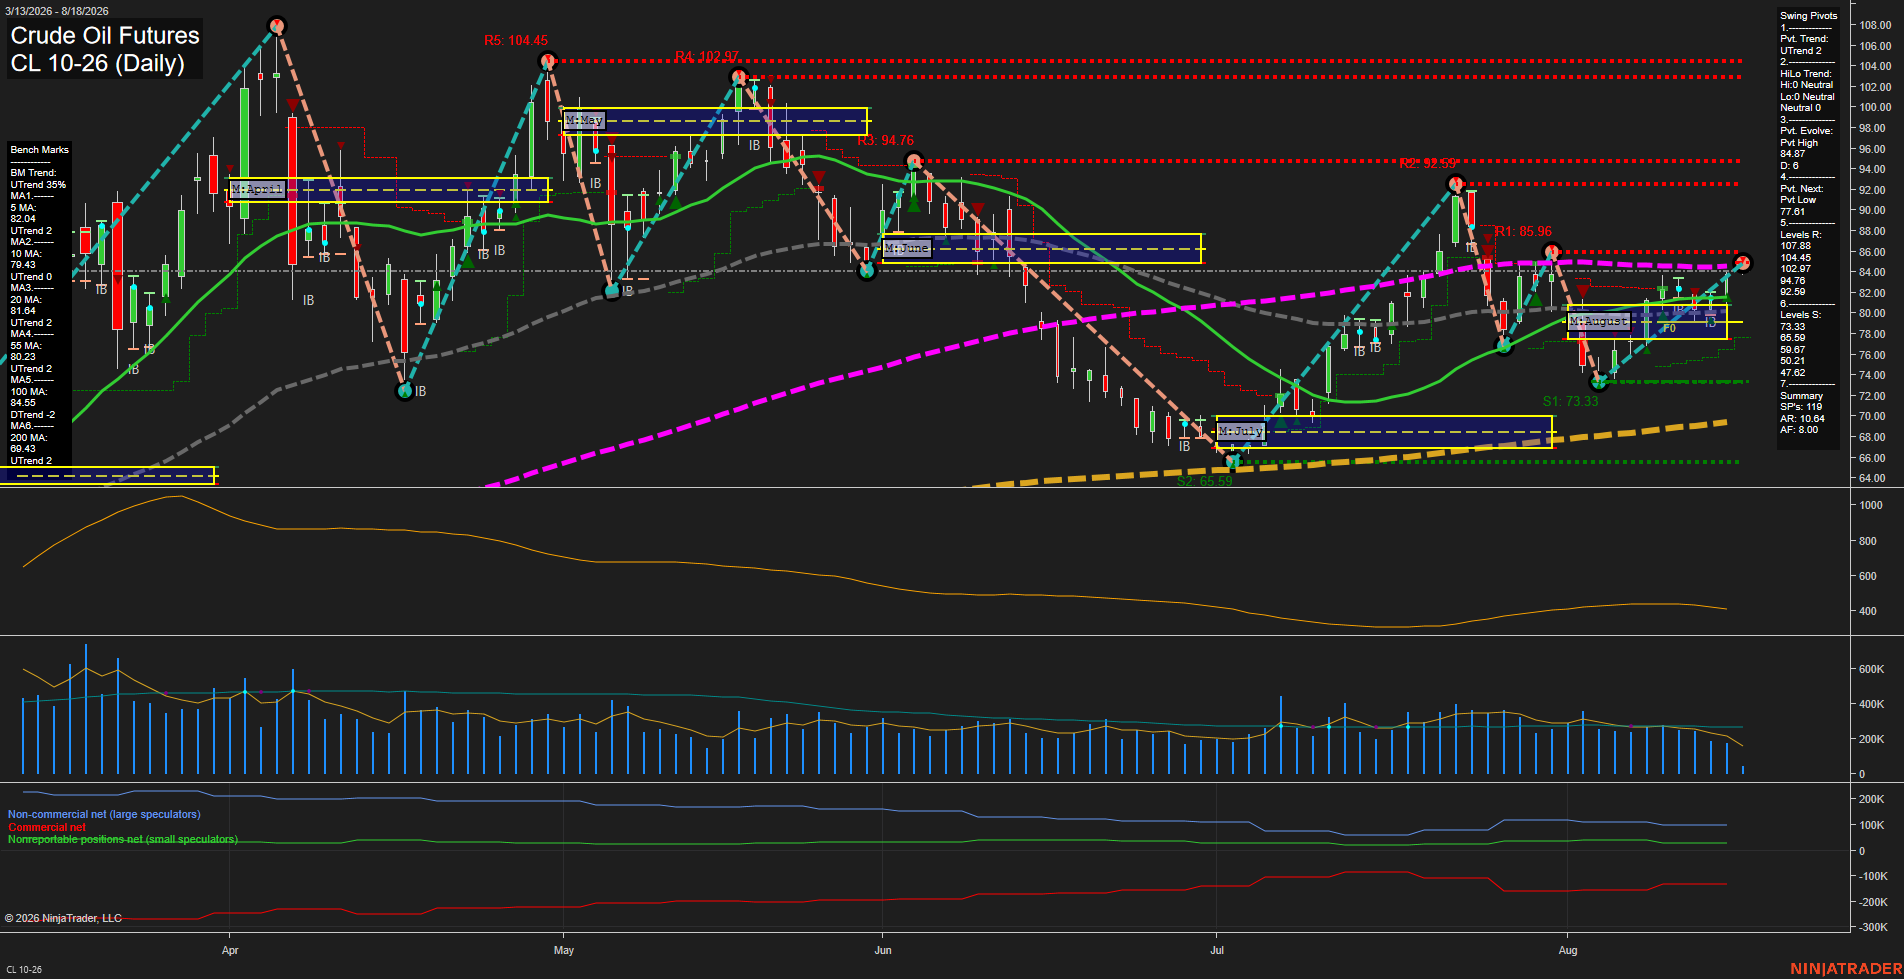
CL Crude Oil Futures Daily Chart Analysis: 2026-Aug-18 07:02 CT
Price Action
- Last: 84.86,
- Bars: Medium,
- Mom: Average.
WSFG Weekly
- Short-Term
- WSFG Current: 27%
- F0%/NTZ' Bias: Price Above,
- WSFG Trend: Up.
MSFG Month Aug
- Intermediate-Term
- MSFG Current: 20%
- F0%/NTZ' Bias: Price Above,
- MSFG Trend: Up.
YSFG Year 2026
- Long-Term
- YSFG Current: 117%
- F0%/NTZ' Bias: Price Above,
- YSFG Trend: Up.
Swing Pivots
- (Short-Term) 1. Pvt. Trend: UTrend,
- (Intermediate-Term) 2. HiLo Trend: UTrend,
- 3. Pvt. Evolve: Pvt high 84.87,
- 4. Pvt. Next: Pvt low 77.01,
- 5. Levels R: 107.88, 104.45, 102.97, 94.76, 92.59, 85.96,
- 6. Levels S: 82.59, 73.33, 65.59.
Daily Benchmarks
- (Short-Term) 5 Day: 82.06 Up Trend,
- (Short-Term) 10 Day: 79.43 Up Trend,
- (Intermediate-Term) 20 Day: 81.60 Up Trend,
- (Intermediate-Term) 55 Day: 80.21 Up Trend,
- (Long-Term) 100 Day: 84.55 Down Trend,
- (Long-Term) 200 Day: 69.41 Up Trend.
Additional Metrics
Recent Trade Signals
- 18 Aug 2026: Long CL 10-26 @ 84.35 Signals.USAR-MSFG
- 18 Aug 2026: Long CL 09-26 @ 84.93 Signals.USAR.TR120
- 17 Aug 2026: Long CL 10-26 @ 83.96 Signals.USAR-WSFG
Overall Rating
- Short-Term: Bullish,
- Intermediate-Term: Bullish,
- Long-Term: Bullish.
Key Insights Summary
Price has recovered strongly from the early-August 73.33 pivot low, establishing higher lows and reclaiming the rising 5, 10, 20, and 55-day benchmarks. The weekly and monthly fib-grid structures remain upward, while price is pressing beneath nearby 85.96 pivot resistance and the declining 100-day average near 84.55. The swing-pivot structure is in an uptrend, but the current evolving pivot high shows a potentially consolidative area beneath the 85.96 to 92.59 resistance band. Volume is below its stated VOLMA, indicating the advance has occurred with moderate participation rather than broad expansion.
Chart Analysis ATS AI Generated: 2026-08-18 07:02 for Informational use only, not trading advice. Terms and Risk Disclosure Copyright © 2026. Algo Trading Systems LLC.