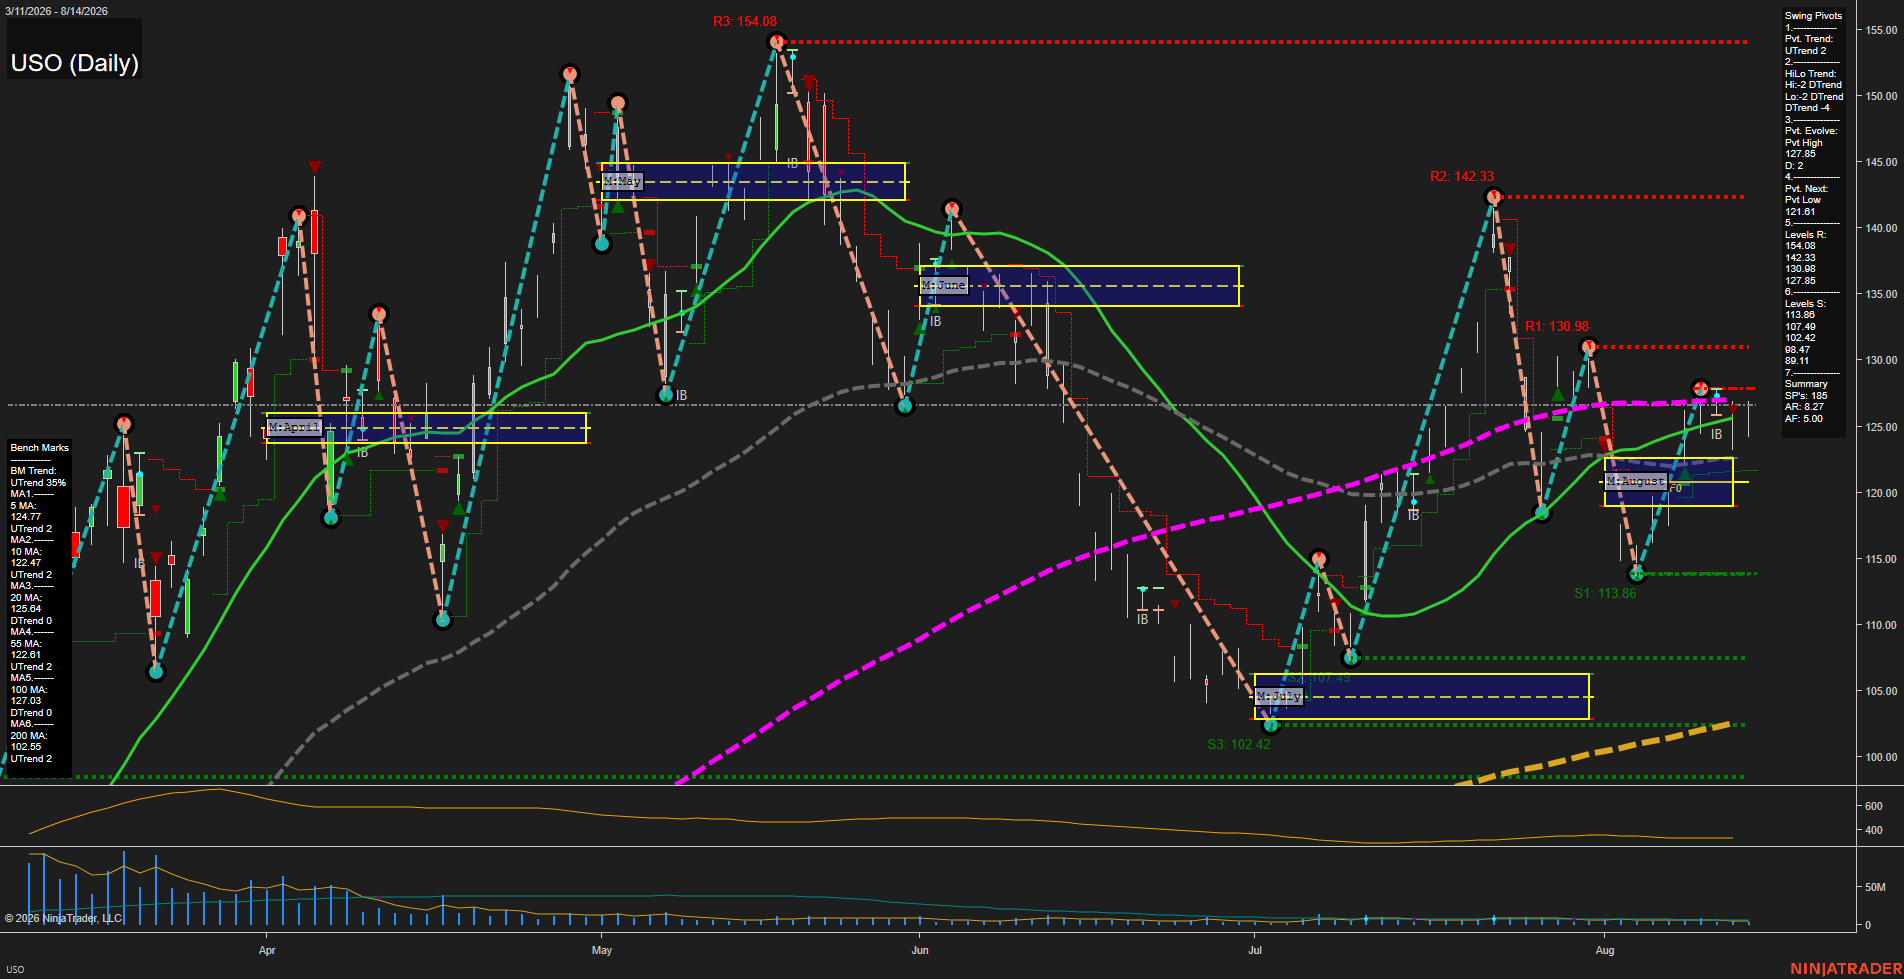
USO United States Oil Fund LP Daily Chart Analysis: 2026-Aug-17 07:10 CT
Price Action
- Last: 127.85,
- Bars: Small,
- Mom: Slow.
WSFG Weekly
- Short-Term
- WSFG Current: NA%
- F0%/NTZ' Bias: Price Neutral,
- WSFG Trend: Neutral.
MSFG Month Aug
- Intermediate-Term
- MSFG Current: NA%
- F0%/NTZ' Bias: Price Above NTZ,
- MSFG Trend: Bullish.
YSFG Year 2026
- Long-Term
- YSFG Current: NA%
- F0%/NTZ' Bias: Price Neutral,
- YSFG Trend: Neutral.
Swing Pivots
- (Short-Term) 1. Pvt. Trend: UTrend,
- (Intermediate-Term) 2. HiLo Trend: DTrend,
- 3. Pvt. Evolve: Pvt high 127.85,
- 4. Pvt. Next: Pvt low 121.61,
- 5. Levels R: 154.08, 142.33, 130.98, 127.85,
- 6. Levels S: 113.86, 107.49, 102.42, 98.47, 89.11, 79.11.
Daily Benchmarks
- (Short-Term) 5 Day: 124.77 Up Trend,
- (Short-Term) 10 Day: 122.47 Up Trend,
- (Intermediate-Term) 20 Day: 125.64 Down Trend,
- (Intermediate-Term) 55 Day: 122.61 Up Trend,
- (Long-Term) 100 Day: 127.03 Down Trend,
- (Long-Term) 200 Day: 102.55 Up Trend.
Additional Metrics
- ATR: 5.00,
- VOLMA: 2577640.
Overall Rating
- Short-Term: Bullish,
- Intermediate-Term: Neutral,
- Long-Term: Neutral.
Key Insights Summary
USO reflects a futures-style recovery phase from the 113.86 swing low, with the short-term pivot structure now in an UTrend and price holding above the rising 5-day, 10-day, and 55-day benchmarks. The rally has reached the 127.85 pivot-high area and is consolidating with smaller daily bars and slower momentum, while 130.98 remains the next nearby overhead swing resistance. Intermediate structure remains mixed because the HiLo trend and 20-day benchmark trend are still down, despite price trading above the 20-day and 55-day averages. The August monthly grid is beneath price, indicating a bullish monthly location, while reduced volume participation and the 5.00 ATR characterize a less impulsive advance following the sharp rebound.
Chart Analysis ATS AI Generated: 2026-08-17 07:10 for Informational use only, not trading advice. Terms and Risk Disclosure Copyright © 2026. Algo Trading Systems LLC.