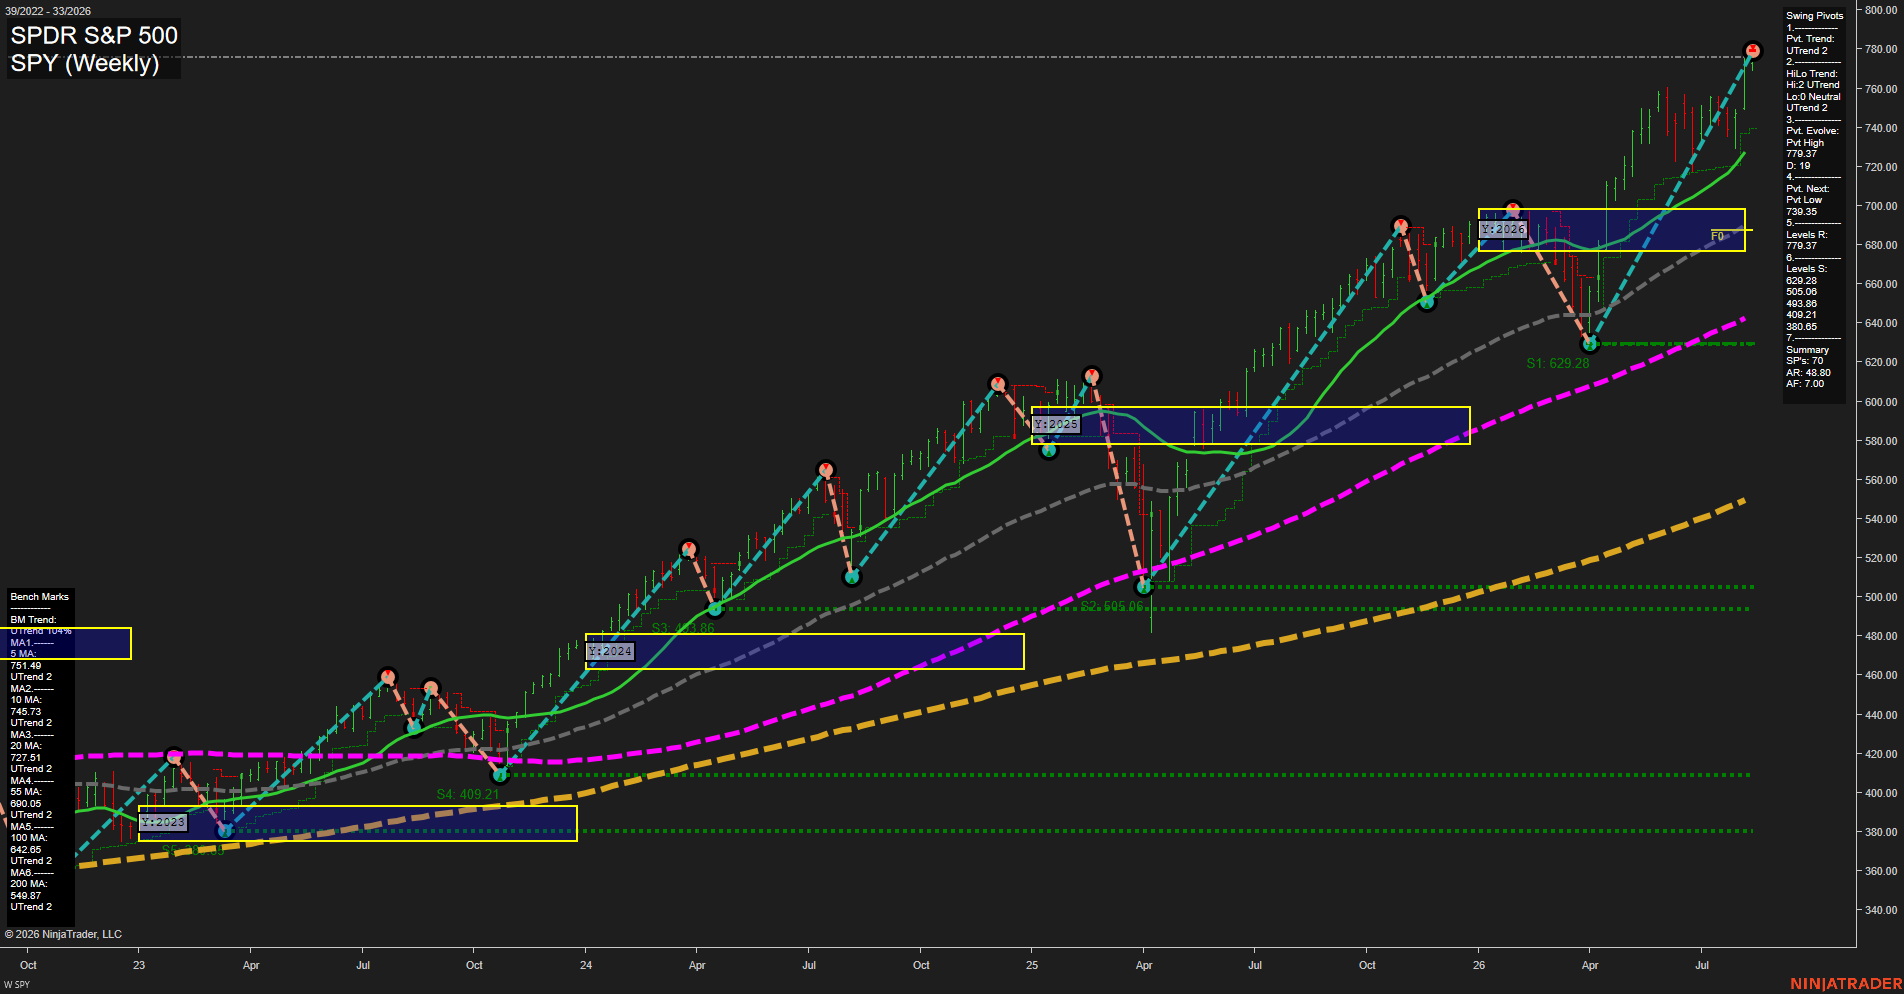
SPY SPDR S&P 500 Weekly Chart Analysis: 2026-Aug-17 07:09 CT
Price Action
- Last: 775.95,
- Bars: Medium,
- Mom: Fast.
WSFG Weekly
- Short-Term
- WSFG Current: NA%
- F0%/NTZ' Bias: Price Above NTZ,
- WSFG Trend: Bullish.
MSFG Month Aug
- Intermediate-Term
- MSFG Current: NA%
- F0%/NTZ' Bias: Price Above NTZ,
- MSFG Trend: Bullish.
YSFG Year 2026
- Long-Term
- YSFG Current: NA%
- F0%/NTZ' Bias: Price Above NTZ,
- YSFG Trend: Bullish.
Swing Pivots
- (Short-Term) 1. Pvt. Trend: UTrend,
- (Intermediate-Term) 2. HiLo Trend: UTrend,
- 3. Pvt. Evolve: Pvt high 779.37,
- 4. Pvt. Next: Pvt low 739.35,
- 5. Levels R: 779.37,
- 6. Levels S: 629.28, 505.08, 493.88, 409.21, 380.65.
Weekly Benchmarks
- (Short-Term) 5 Day: 751.49 Up Trend,
- (Short-Term) 10 Day: 745.73 Up Trend,
- (Intermediate-Term) 20 Day: 727.51 Up Trend,
- (Intermediate-Term) 55 Day: 690.05 Up Trend,
- (Long-Term) 100 Day: 642.65 Up Trend,
- (Long-Term) 200 Day: 548.97 Up Trend.
Overall Rating
- Short-Term: Bullish,
- Intermediate-Term: Bullish,
- Long-Term: Bullish.
Key Insights Summary
SPY’s weekly structure represents a strong index-futures swing environment: price is extended above the yearly NTZ, all benchmark averages are rising, and the pivot sequence remains higher-high/higher-low bullish. The current advance is testing the 779.37 pivot-high resistance area after a fast recovery from the 739.35 pivot-low reversal level. For futures swing context, the market remains trend-driven rather than rotational, although the recent steep ascent and proximity to pivot resistance reflect elevated extension and the potential for consolidation around the new highs.
Chart Analysis ATS AI Generated: 2026-08-17 07:10 for Informational use only, not trading advice. Terms and Risk Disclosure Copyright © 2026. Algo Trading Systems LLC.