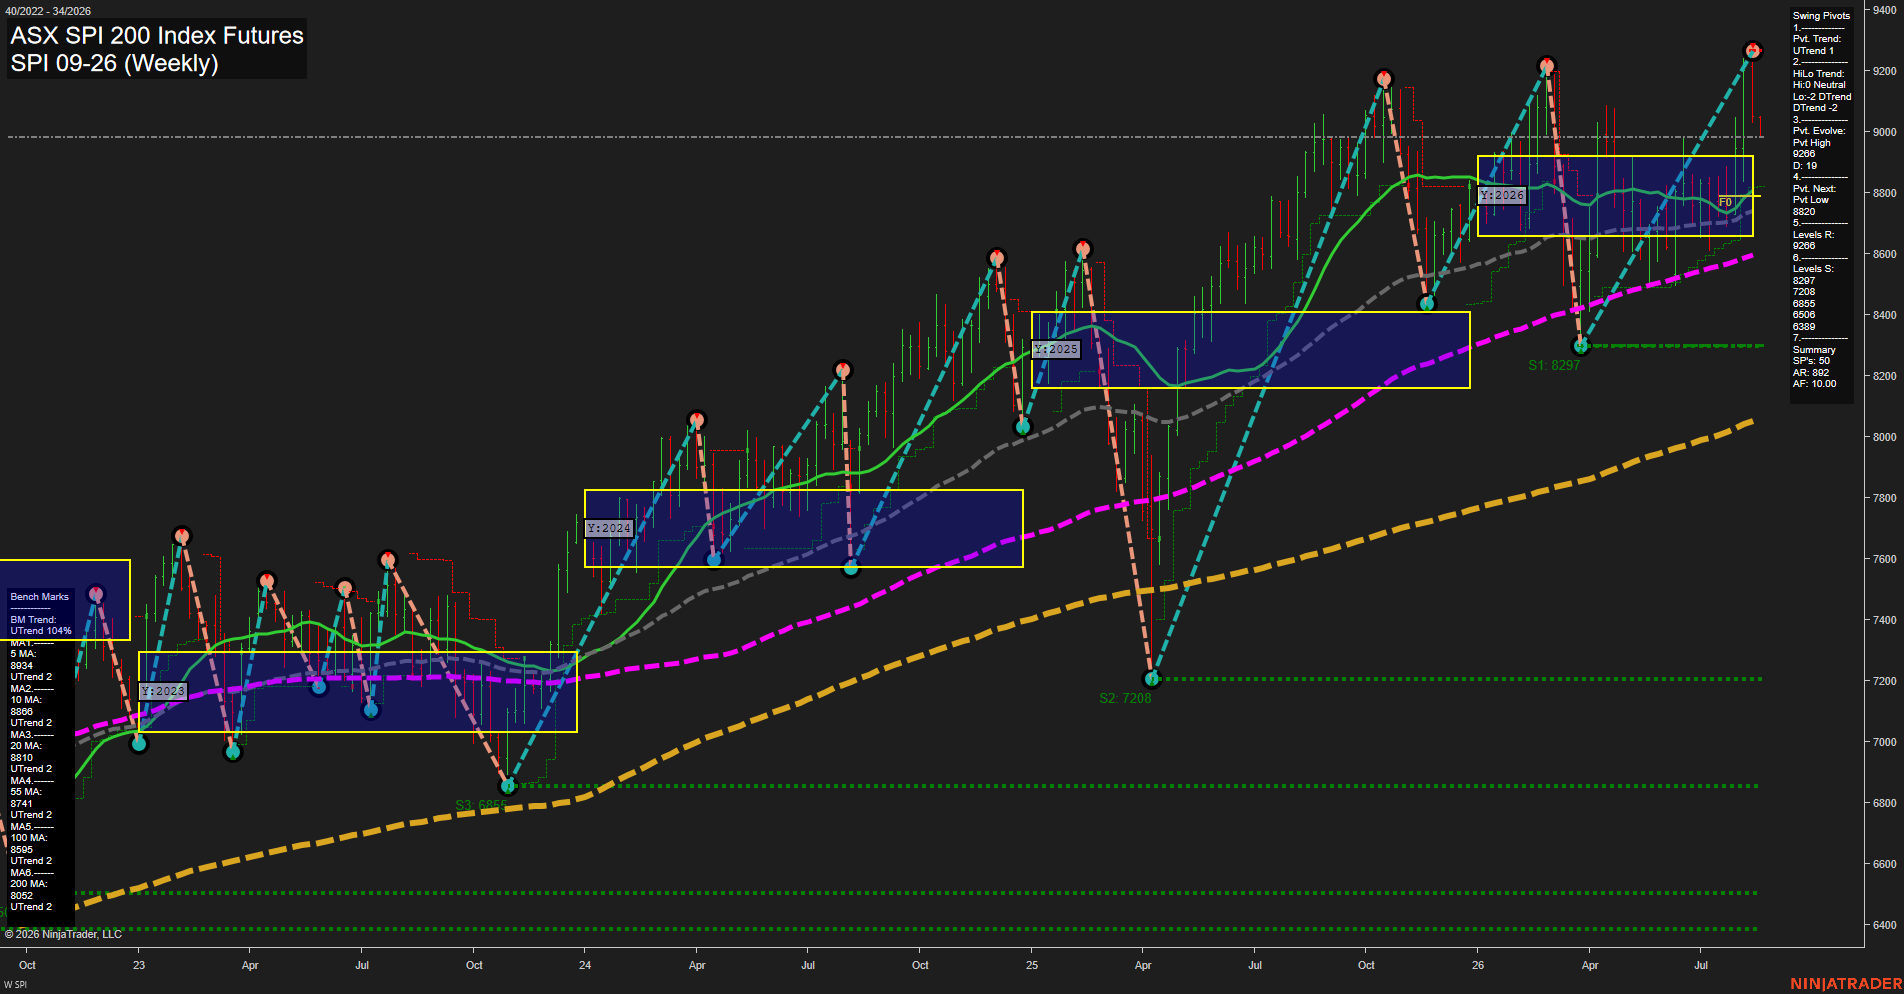
SPI ASX SPI 200 Index Futures Weekly Chart Analysis: 2026-Aug-17 07:09 CT
Price Action
- Last: 8987,
- Bars: Large,
- Mom: Fast.
WSFG Weekly
- Short-Term
- WSFG Current: 62%
- F0%/NTZ' Bias: Price Bullish,
- WSFG Trend: UTrend.
MSFG Month Aug
- Intermediate-Term
- MSFG Current: 66%
- F0%/NTZ' Bias: Price Bullish,
- MSFG Trend: UTrend.
YSFG Year 2026
- Long-Term
- YSFG Current: 64%
- F0%/NTZ' Bias: Price Bullish,
- YSFG Trend: UTrend.
Swing Pivots
- (Short-Term) 1. Pvt. Trend: UTrend,
- (Intermediate-Term) 2. HiLo Trend: UTrend,
- 3. Pvt. Evolve: Pvt high 9266,
- 4. Pvt. Next: Pvt low 8820,
- 5. Levels R: 9266,
- 6. Levels S: 8297, 7208, 6855, 6506, 6339.
Weekly Benchmarks
- (Short-Term) 5 Day: 9344 Up Trend,
- (Short-Term) 10 Day: 8860 Up Trend,
- (Intermediate-Term) 20 Day: 8810 Up Trend,
- (Intermediate-Term) 55 Day: 8741 Up Trend,
- (Long-Term) 100 Day: 8595 Up Trend,
- (Long-Term) 200 Day: 8052 Up Trend.
Overall Rating
- Short-Term: Bullish,
- Intermediate-Term: Bullish,
- Long-Term: Bullish.
Key Insights Summary
Price remains within a broad weekly advance, supported by an upward-aligned benchmark structure from the 10-period through 200-period averages. The recent retreat from the 9266 pivot high has produced a fast, large-range counter-trend bar, but price remains above the 10, 20, 55, 100, and 200 benchmarks. The active pivot structure remains UTrend, with 9266 defining the principal overhead resistance and 8820 the nearby reversal threshold. The yearly fib grid places price above the F0%/NTZ area, preserving a positive long-term bias while the market consolidates beneath the prior swing high.
Chart Analysis ATS AI Generated: 2026-08-17 07:09 for Informational use only, not trading advice. Terms and Risk Disclosure Copyright © 2026. Algo Trading Systems LLC.