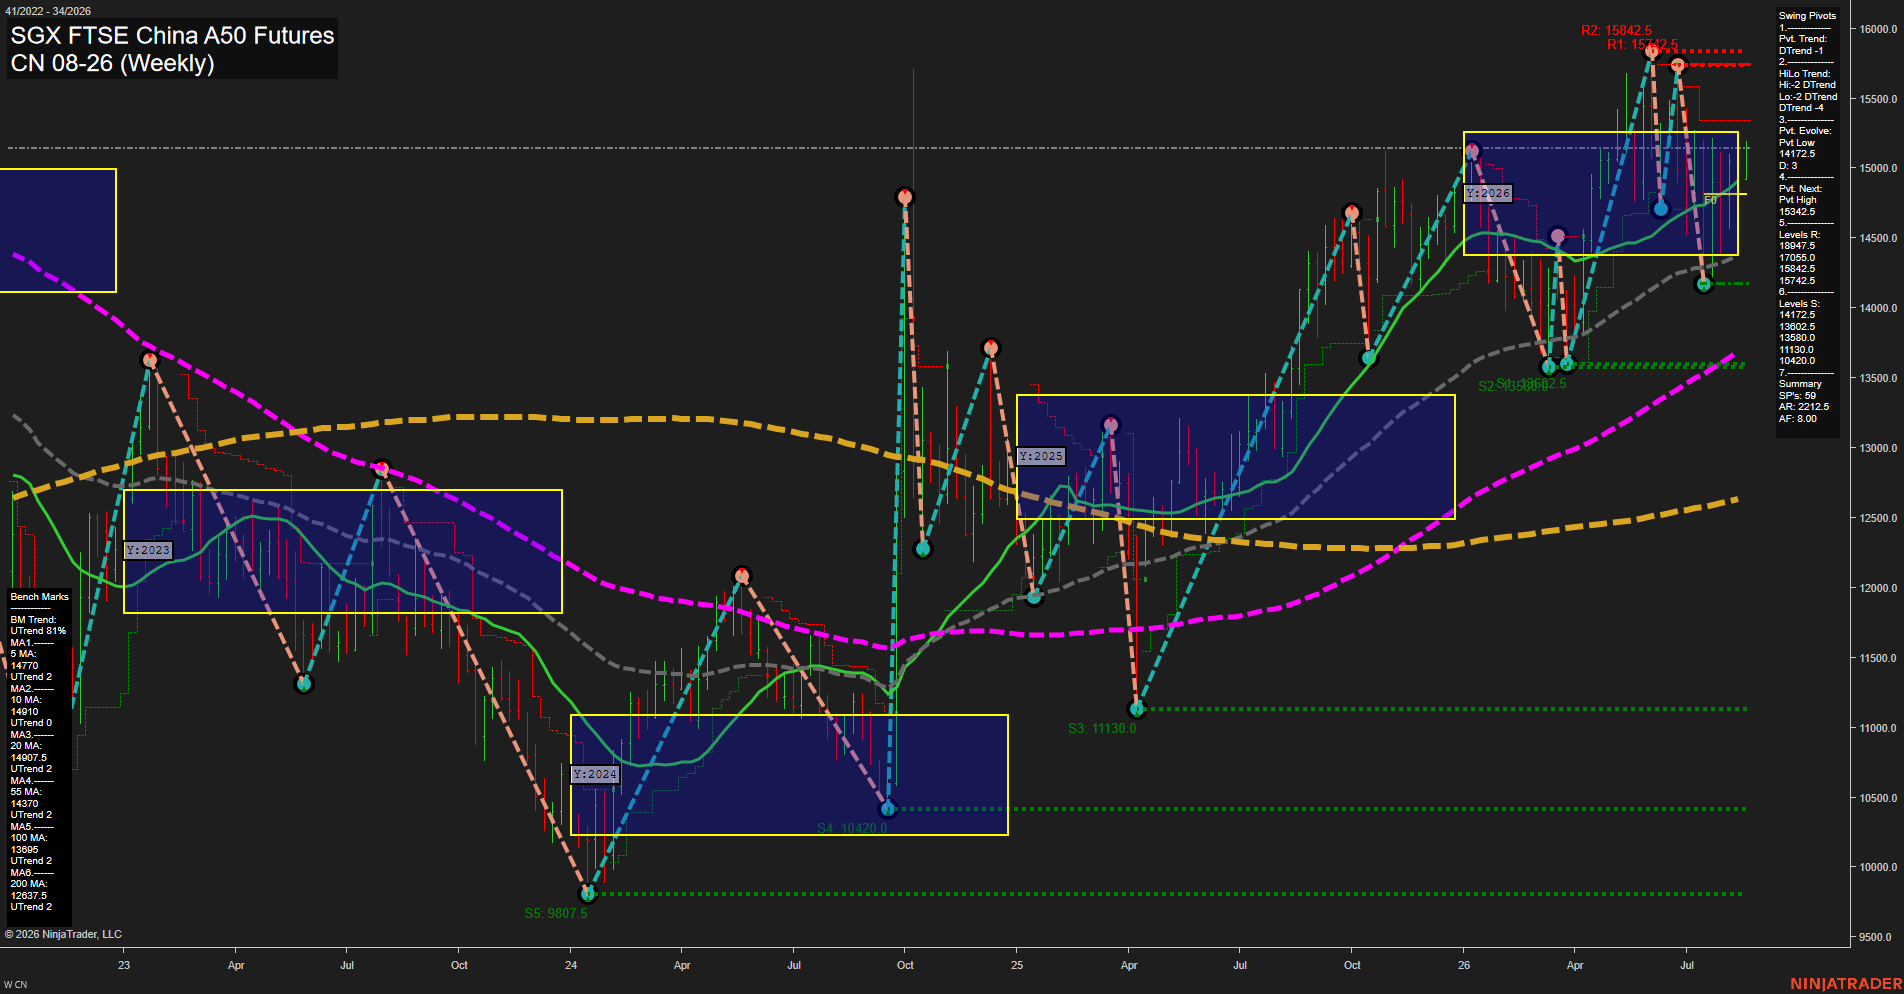
CN SGX FTSE China A50 Futures Weekly Chart Analysis: 2026-Aug-17 07:03 CT
Price Action
- Last: 15142.5,
- Bars: Large,
- Mom: Fast.
WSFG Weekly
- Short-Term
- WSFG Current: NA%
- F0%/NTZ' Bias: Price Neutral,
- WSFG Trend: Neutral.
MSFG Month Aug
- Intermediate-Term
- MSFG Current: NA%
- F0%/NTZ' Bias: Price Neutral,
- MSFG Trend: Neutral.
YSFG Year 2026
- Long-Term
- YSFG Current: 86%
- F0%/NTZ' Bias: Price Above F0% in NTZ Upper,
- YSFG Trend: Bullish.
Swing Pivots
- (Short-Term) 1. Pvt. Trend: DTrend,
- (Intermediate-Term) 2. HiLo Trend: DTrend,
- 3. Pvt. Evolve: Pvt low 14712.5,
- 4. Pvt. Next: Pvt high 15342.5,
- 5. Levels R: 15842.5, 15742.5, 15500.0, 15342.5,
- 6. Levels S: 14712.5, 13602.5, 13580.0, 11130.0.
Weekly Benchmarks
- (Short-Term) 5 Day: 14770.0 Up Trend,
- (Short-Term) 10 Day: 14910.0 Up Trend,
- (Intermediate-Term) 20 Day: 14900.5 Up Trend,
- (Intermediate-Term) 55 Day: 14370.0 Up Trend,
- (Long-Term) 100 Day: 13695.0 Up Trend,
- (Long-Term) 200 Day: 12637.5 Up Trend.
Overall Rating
- Short-Term: Neutral,
- Intermediate-Term: Bullish,
- Long-Term: Bullish.
Key Insights Summary
Price has staged a fast, volatile rebound from the 14712.5 pivot low and is holding above the rising 5, 10, 20, and 55 week benchmarks. The immediate swing structure remains in a DTrend until a new pivot high is confirmed above 15342.5, leaving the market in a sharp countertrend recovery within a broader bullish moving-average alignment. The yearly grid position is in the upper NTZ, while 15342.5 and the 15500.0 to 15842.5 resistance band define the overhead swing supply zone. The 14712.5 level is the nearest structural support, followed by the clustered 13602.5 and 13580.0 supports.
Chart Analysis ATS AI Generated: 2026-08-17 07:03 for Informational use only, not trading advice. Terms and Risk Disclosure Copyright © 2026. Algo Trading Systems LLC.