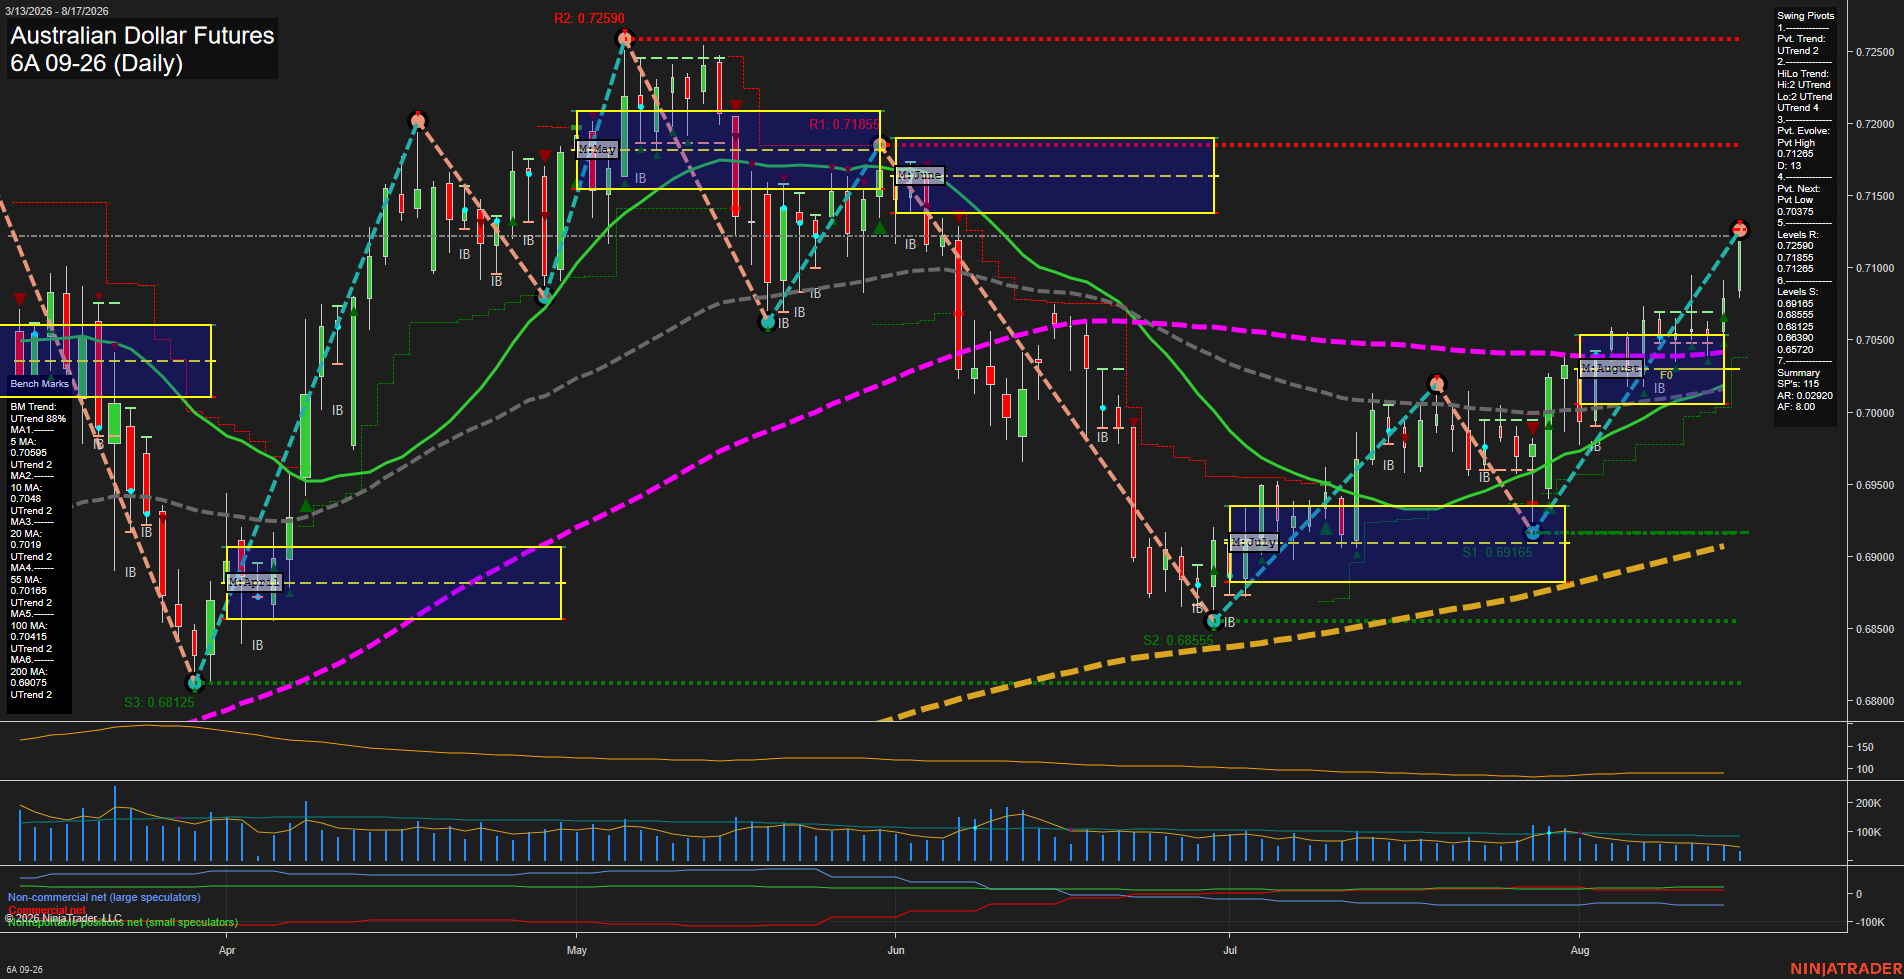
6A Australian Dollar Futures Daily Chart Analysis: 2026-Aug-17 07:00 CT
Price Action
- Last: 0.71265,
- Bars: Medium,
- Mom: Fast.
WSFG Weekly
- Short-Term
- WSFG Current: NA%
- F0%/NTZ' Bias: Price Neutral,
- WSFG Trend: Neutral.
MSFG Month Aug
- Intermediate-Term
- MSFG Current: 198%
- F0%/NTZ' Bias: Price Above NTZ,
- MSFG Trend: UTrend.
YSFG Year 2026
- Long-Term
- YSFG Current: NA%
- F0%/NTZ' Bias: Price Neutral,
- YSFG Trend: Neutral.
Swing Pivots
- (Short-Term) 1. Pvt. Trend: UTrend,
- (Intermediate-Term) 2. HiLo Trend: UTrend,
- 3. Pvt. Evolve: Pvt high 0.71265,
- 4. Pvt. Next: Pvt low 0.70375,
- 5. Levels R: 0.72590, 0.71855, 0.71265,
- 6. Levels S: 0.69165, 0.68555, 0.68125.
Daily Benchmarks
- (Short-Term) 5 Day: 0.70955 Up Trend,
- (Short-Term) 10 Day: 0.70480 Up Trend,
- (Intermediate-Term) 20 Day: 0.70090 Up Trend,
- (Intermediate-Term) 55 Day: 0.70165 Up Trend,
- (Long-Term) 100 Day: 0.70415 Up Trend,
- (Long-Term) 200 Day: 0.69075 Up Trend.
Additional Metrics
Overall Rating
- Short-Term: Bullish,
- Intermediate-Term: Bullish,
- Long-Term: Bullish.
Key Insights Summary
The daily structure is broadly bullish: price has rallied sharply from the July low, pivot and HiLo trends are both upward, and price is above all six rising benchmark averages. The market is pressing the 0.71265 pivot-high resistance after a fast August recovery, with 0.71855 and 0.72590 defining the next higher resistance structure. The 0.70375 pivot-low reversal level and the clustered 10-to-100 day averages near 0.70165 to 0.70480 represent the principal retracement and trend-continuity area. August price action is extended above the monthly NTZ, while declining ATR and lighter volume relative to earlier swings indicate a more orderly advance rather than a broad volatility expansion.
Chart Analysis ATS AI Generated: 2026-08-17 07:00 for Informational use only, not trading advice. Terms and Risk Disclosure Copyright © 2026. Algo Trading Systems LLC.