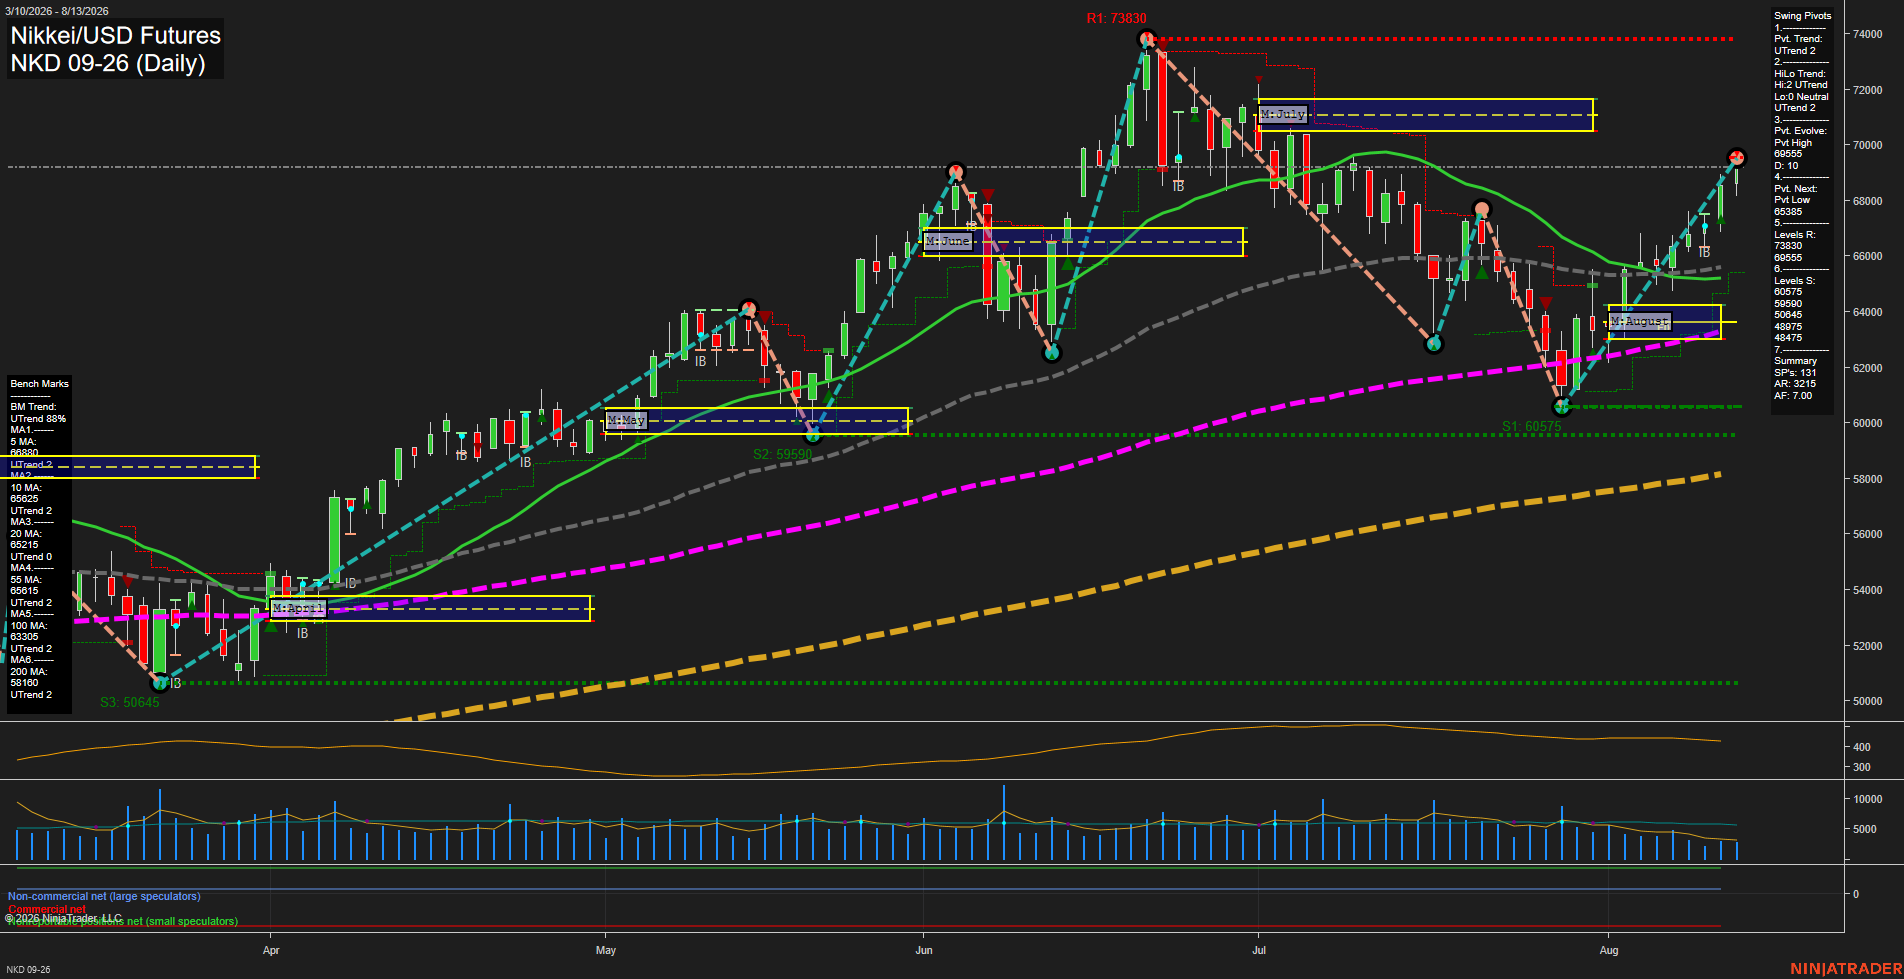
NKD Nikkei/USD Futures Daily Chart Analysis: 2026-Aug-14 07:07 CT
Price Action
- Last: 69310,
- Bars: Medium,
- Mom: Fast.
WSFG Weekly
- Short-Term
- WSFG Current: 55%
- F0%/NTZ' Bias: Price Above,
- WSFG Trend: Up.
MSFG Month Aug
- Intermediate-Term
- MSFG Current: 66%
- F0%/NTZ' Bias: Price Above,
- MSFG Trend: Up.
YSFG Year 2026
- Long-Term
- YSFG Current: 216%
- F0%/NTZ' Bias: Price Above,
- YSFG Trend: Up.
Swing Pivots
- (Short-Term) 1. Pvt. Trend: UTrend,
- (Intermediate-Term) 2. HiLo Trend: UTrend,
- 3. Pvt. Evolve: Pvt high 69510,
- 4. Pvt. Next: Pvt low 65385,
- 5. Levels R: 73830, 69510,
- 6. Levels S: 60575, 59590, 50645.
Daily Benchmarks
- (Short-Term) 5 Day: 68880 Up Trend,
- (Short-Term) 10 Day: 65625 Up Trend,
- (Intermediate-Term) 20 Day: 65215 Up Trend,
- (Intermediate-Term) 55 Day: 65615 Up Trend,
- (Long-Term) 100 Day: 63306 Up Trend,
- (Long-Term) 200 Day: 58160 Up Trend.
Additional Metrics
Recent Trade Signals
- 11 Aug 2026: Long NKD 09-26 @ 67125 Signals.USAR-WSFG
Overall Rating
- Short-Term: Bullish,
- Intermediate-Term: Bullish,
- Long-Term: Bullish.
Key Insights Summary
NKD is extending a sharp V-shaped recovery from the 60575 swing low, with price holding above all daily benchmark averages and both weekly and monthly Fib-grid bias measures remaining positive. The short-term pivot structure is in an uptrend and is testing the 69510 evolving pivot high, while 73830 remains the larger overhead swing resistance. The advance is fast and has produced medium-sized bars near the recent high, indicating an energetic continuation phase rather than a broad consolidation. Intermediate and long-term structure remain constructive through higher swing lows, upward-sloping benchmarks, and price materially above the annual Fib reference area.
Chart Analysis ATS AI Generated: 2026-08-14 07:08 for Informational use only, not trading advice. Terms and Risk Disclosure Copyright © 2026. Algo Trading Systems LLC.