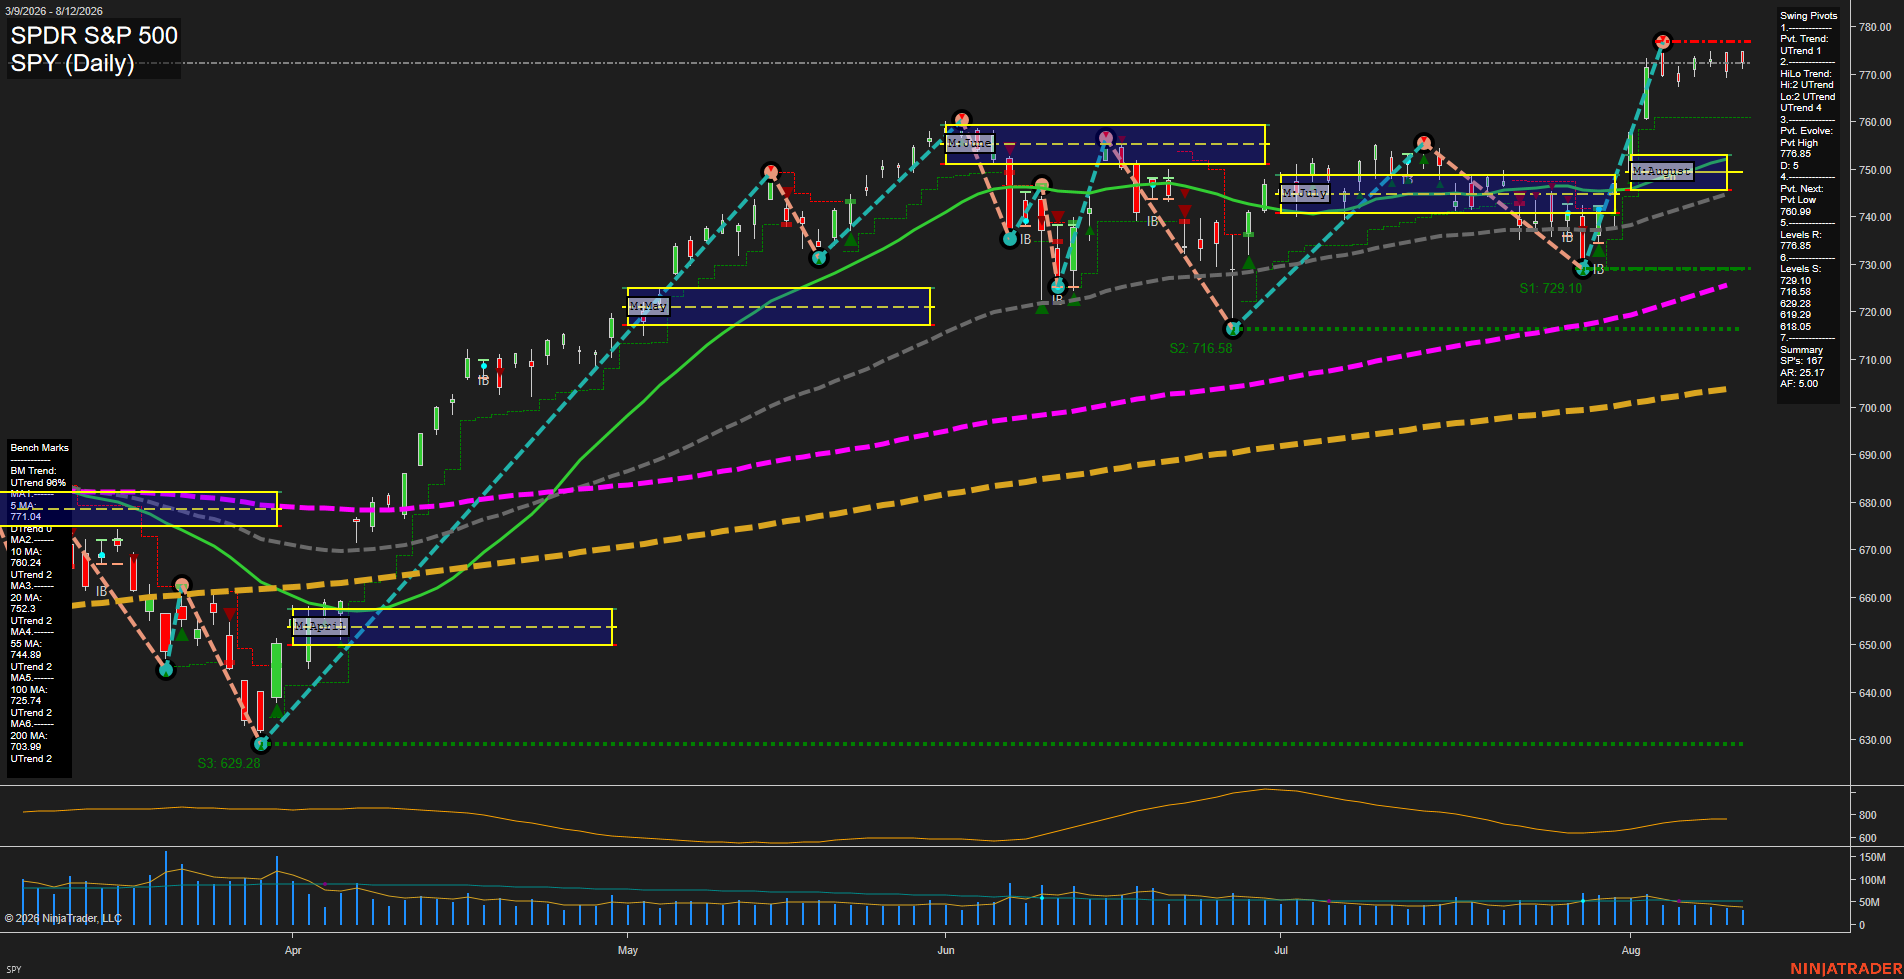
SPY SPDR S&P 500 Daily Chart Analysis: 2026-Aug-13 07:10 CT
Price Action
- Last: 771.04,
- Bars: Small,
- Mom: Slow.
WSFG Weekly
- Short-Term
- WSFG Current: NA%
- F0%/NTZ' Bias: Price Neutral,
- WSFG Trend: Neutral.
MSFG Month Aug
- Intermediate-Term
- MSFG Current: NA%
- F0%/NTZ' Bias: Price Bullish,
- MSFG Trend: Bullish.
YSFG Year 2026
- Long-Term
- YSFG Current: NA%
- F0%/NTZ' Bias: Price Neutral,
- YSFG Trend: Neutral.
Swing Pivots
- (Short-Term) 1. Pvt. Trend: UTrend,
- (Intermediate-Term) 2. HiLo Trend: UTrend,
- 3. Pvt. Evolve: Pvt high 776.85,
- 4. Pvt. Next: Pvt low 760.99,
- 5. Levels R: 776.85,
- 6. Levels S: 729.10, 716.58, 629.29, 629.28, 618.05.
Daily Benchmarks
- (Short-Term) 5 Day: 771.04 Up Trend,
- (Short-Term) 10 Day: 760.24 Up Trend,
- (Intermediate-Term) 20 Day: 752.95 Up Trend,
- (Intermediate-Term) 55 Day: 744.89 Up Trend,
- (Long-Term) 100 Day: 724.57 Up Trend,
- (Long-Term) 200 Day: 703.99 Up Trend.
Additional Metrics
- ATR: 7.67,
- VOLMA: 47470907.
Overall Rating
- Short-Term: Bullish,
- Intermediate-Term: Bullish,
- Long-Term: Bullish.
Key Insights Summary
SPY, an ES futures proxy, remains in a broad daily swing advance with both pivot structures in UTrend and price positioned above every benchmark average. The recent acceleration into 776.85 has transitioned into small-range consolidation near the highs, indicating slower momentum rather than a confirmed pivot reversal. The 776.85 pivot high is the immediate overhead reference, while 760.99 is the active short-term pivot-reversal level. August MSFG positioning remains bullish above the monthly NTZ/F0% area, and the rising 20-, 55-, 100-, and 200-day averages show aligned intermediate and long-term trend structure. Volume is comparatively contained during the high-level pause, consistent with a mature advance consolidating after a sharp rally.
Chart Analysis ATS AI Generated: 2026-08-13 07:11 for Informational use only, not trading advice. Terms and Risk Disclosure Copyright © 2026. Algo Trading Systems LLC.