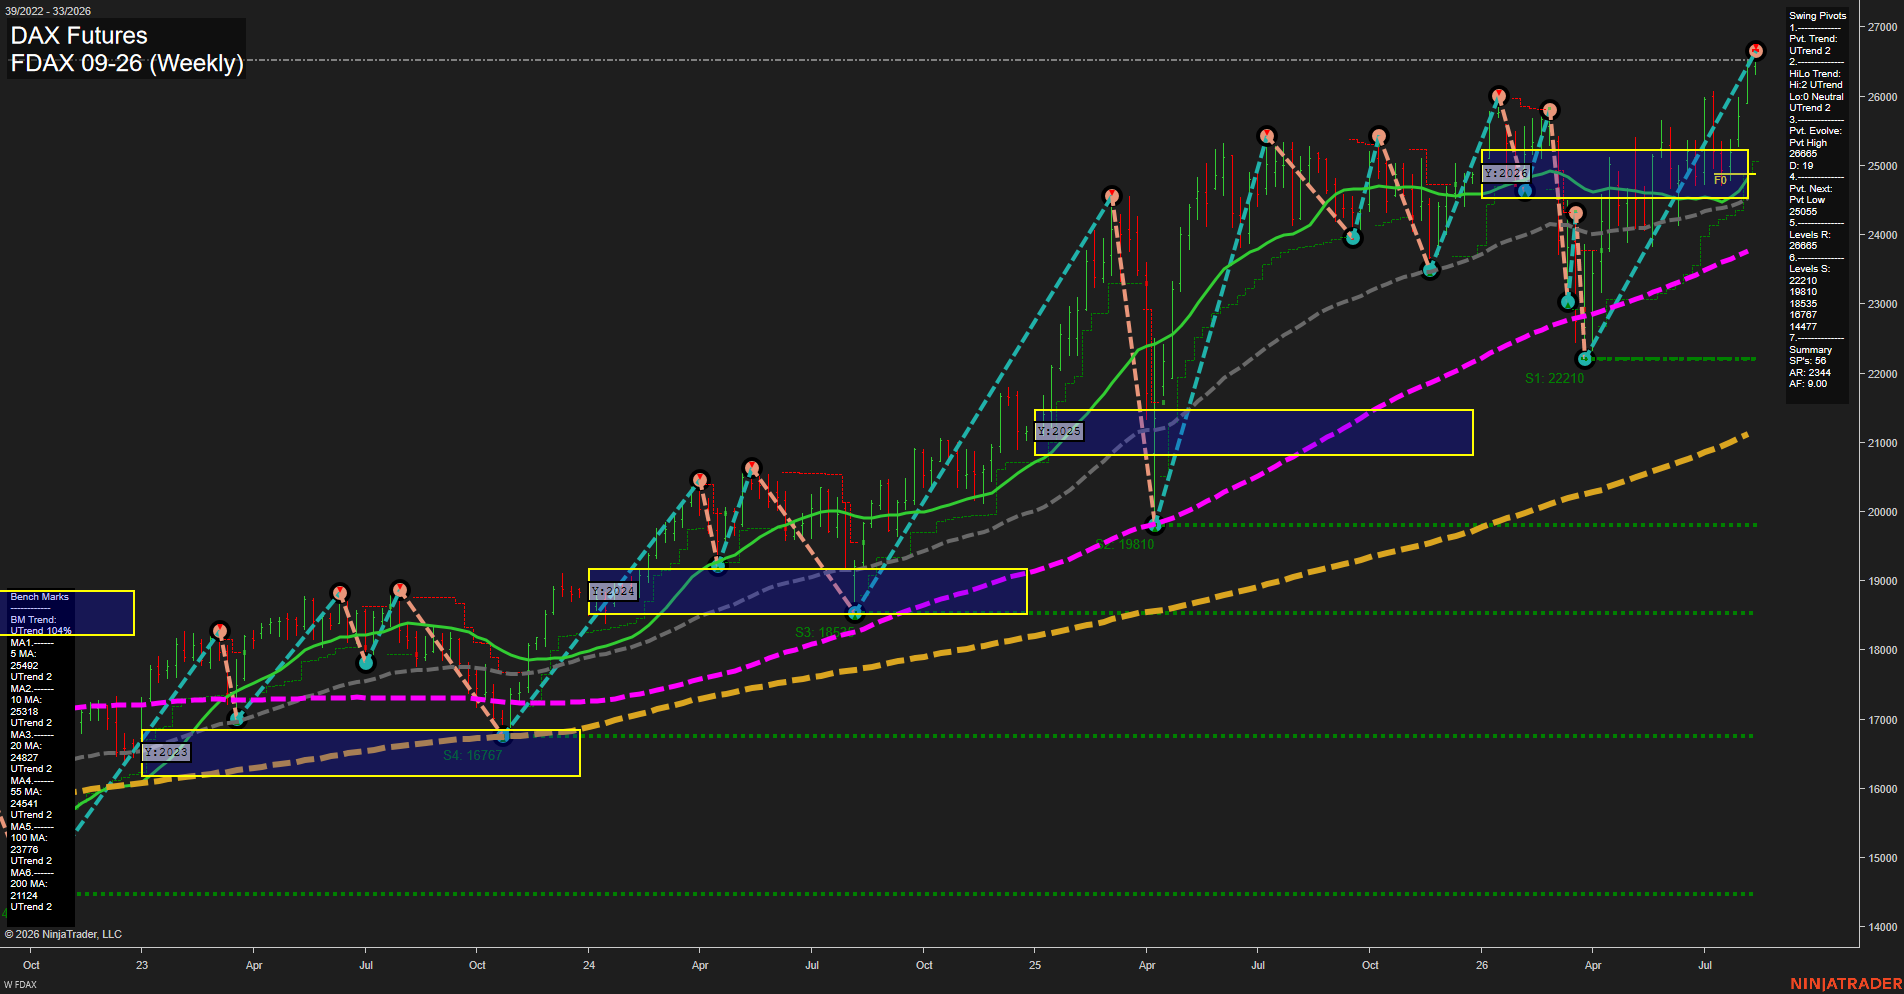
FDAX DAX Futures Weekly Chart Analysis: 2026-Aug-13 07:04 CT
Price Action
- Last: 26665,
- Bars: Medium,
- Mom: fast.
WSFG Weekly
- Short-Term
- WSFG Current: 11%
- F0%/NTZ' Bias: Price Above,
- WSFG Trend: Up.
MSFG Month Aug
- Intermediate-Term
- MSFG Current: 42%
- F0%/NTZ' Bias: Price Above,
- MSFG Trend: Up.
YSFG Year 2026
- Long-Term
- YSFG Current: 46%
- F0%/NTZ' Bias: Price Above,
- YSFG Trend: Up.
Swing Pivots
- (Short-Term) 1. Pvt. Trend: UTrend,
- (Intermediate-Term) 2. HiLo Trend: UTrend,
- 3. Pvt. Evolve: Pvt high 26665,
- 4. Pvt. Next: Pvt low 25055,
- 5. Levels R: 26665,
- 6. Levels S: 22210, 19810, 18535, 17676, 14477.
Weekly Benchmarks
- (Short-Term) 5 Day: 25492 Up Trend,
- (Short-Term) 10 Day: 25318 Up Trend,
- (Intermediate-Term) 20 Day: 24827 Up Trend,
- (Intermediate-Term) 55 Day: 24541 Up Trend,
- (Long-Term) 100 Day: 23776 Up Trend,
- (Long-Term) 200 Day: 21122 Up Trend.
Recent Trade Signals
- 13 Aug 2026: Long FDAX 09-26 @ 26542 Signals.USAR-WSFG
- 06 Aug 2026: Short FDAX 09-26 @ 26201 Signals.USAR.TR120
Overall Rating
- Short-Term: Bullish,
- Intermediate-Term: Bullish,
- Long-Term: Bullish.
Key Insights Summary
FDAX is in a broad weekly bull structure, with price extending to a new pivot high at 26665 and holding above every benchmark average. The swing sequence remains higher-high/higher-low, while the aligned weekly, monthly, and yearly Fib-grid readings confirm upside trend continuity across time frames. Short-term momentum is fast following the recent breakout, creating an extended condition above the 25055 opposite-pivot threshold. The 26665 pivot is the immediate resistance reference, while 25055 is the principal nearer-term structural retracement level; the 24827-24541 20/55-week benchmark band remains the key intermediate trend zone.
Chart Analysis ATS AI Generated: 2026-08-13 07:05 for Informational use only, not trading advice. Terms and Risk Disclosure Copyright © 2026. Algo Trading Systems LLC.