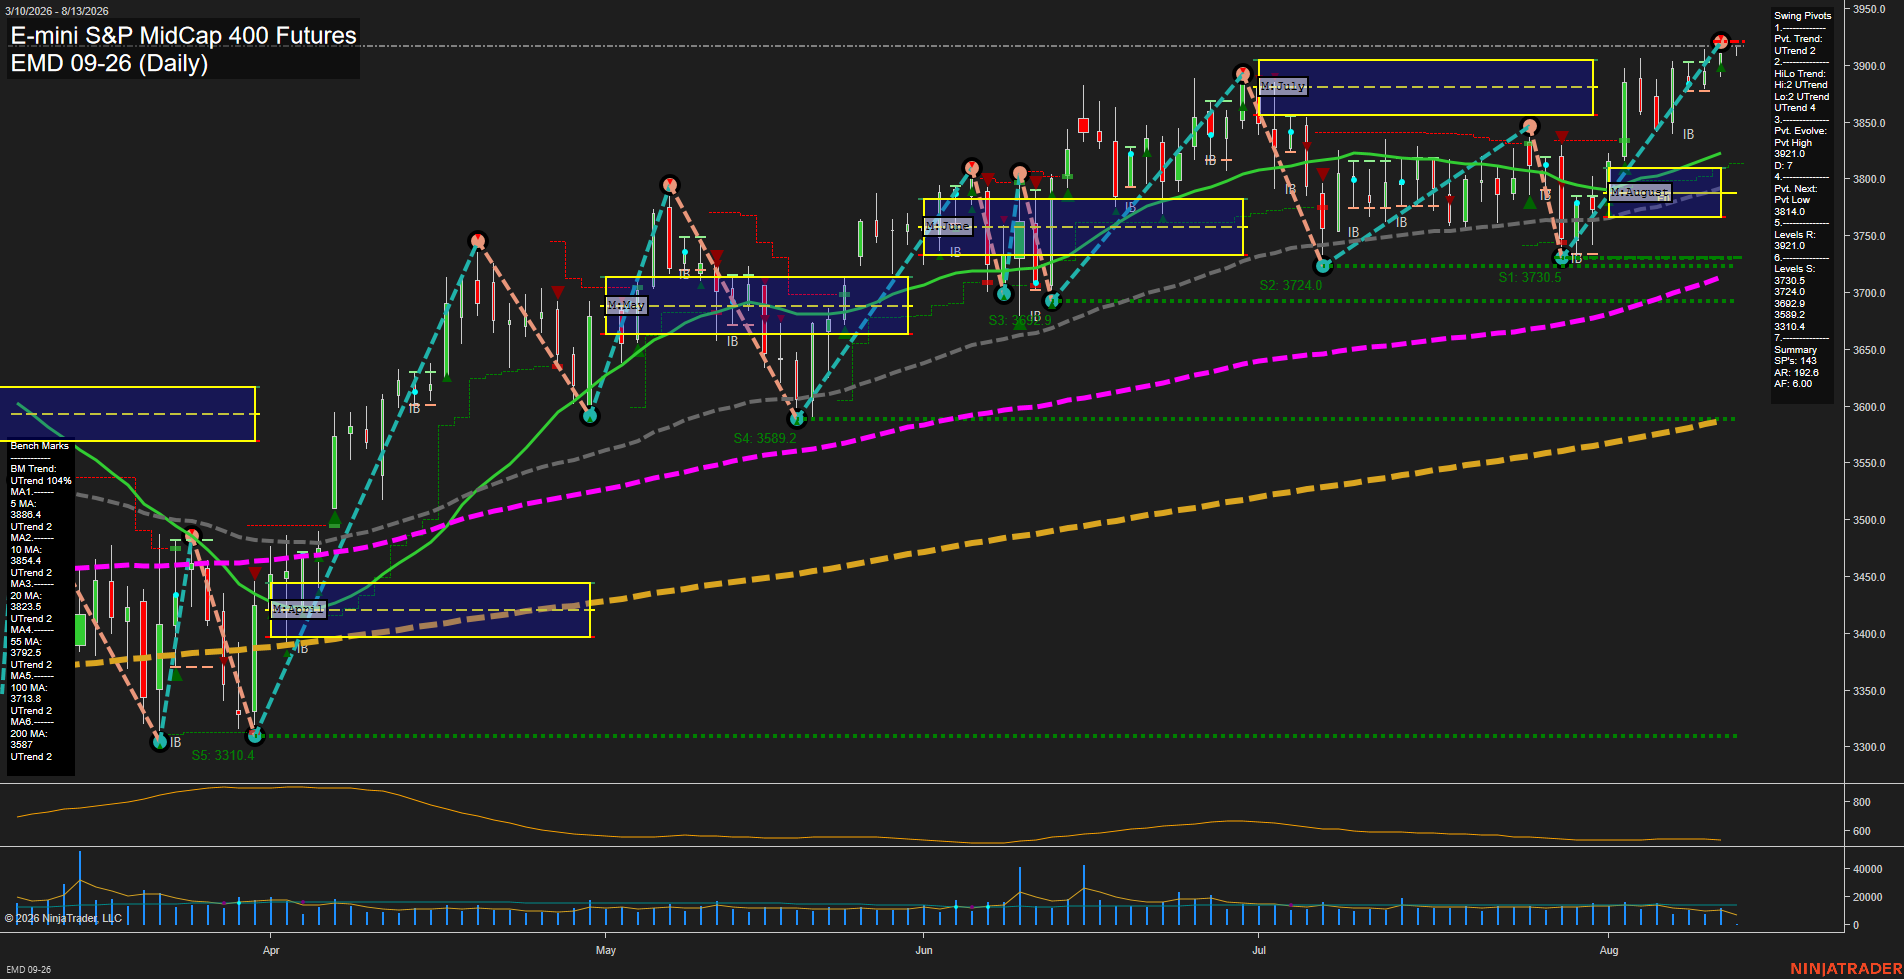
EMD E-mini S&P MidCap 400 Futures Daily Chart Analysis: 2026-Aug-13 07:03 CT
Price Action
- Last: 3927.0,
- Bars: Medium,
- Mom: fast.
WSFG Weekly
- Short-Term
- WSFG Current: 27%
- F0%/NTZ' Bias: Price Above,
- WSFG Trend: Up.
MSFG Month Aug
- Intermediate-Term
- MSFG Current: 70%
- F0%/NTZ' Bias: Price Above,
- MSFG Trend: Up.
YSFG Year 2026
- Long-Term
- YSFG Current: 77%
- F0%/NTZ' Bias: Price Above,
- YSFG Trend: Up.
Swing Pivots
- (Short-Term) 1. Pvt. Trend: UTrend,
- (Intermediate-Term) 2. HiLo Trend: UTrend,
- 3. Pvt. Evolve: Pvt high 3927.0,
- 4. Pvt. Next: Pvt low 3814.0,
- 5. Levels R: 3927.0,
- 6. Levels S: 3730.5, 3724.0, 3692.9, 3589.2, 3310.4.
Daily Benchmarks
- (Short-Term) 5 Day: 3886.4 Up Trend,
- (Short-Term) 10 Day: 3854.4 Up Trend,
- (Intermediate-Term) 20 Day: 3823.6 Up Trend,
- (Intermediate-Term) 55 Day: 3792.5 Up Trend,
- (Long-Term) 100 Day: 3713.8 Up Trend,
- (Long-Term) 200 Day: 3587.0 Up Trend.
Additional Metrics
Recent Trade Signals
- 12 Aug 2026: Long EMD 09-26 @ 3906 Signals.USAR-WSFG
- 05 Aug 2026: Short EMD 09-26 @ 3858.7 Signals.USAR.TR120
Overall Rating
- Short-Term: Bullish,
- Intermediate-Term: Bullish,
- Long-Term: Bullish.
Key Insights Summary
EMD is in a broad multi-timeframe advance, with price pressing the 3927.0 pivot-high resistance area after a sharp August recovery. Short-term momentum is fast and price remains above the weekly and monthly F0%/NTZ reference zones. The pivot structure shows higher highs and higher lows, while all six benchmark averages are rising and positioned below price. The 3814.0 next-pivot threshold defines the nearby structural pullback level; deeper support is layered from 3730.5 through 3692.9. ATR and volume conditions indicate active, but not exceptional, daily range participation as the contract tests the upper edge of its recent swing.
Chart Analysis ATS AI Generated: 2026-08-13 07:03 for Informational use only, not trading advice. Terms and Risk Disclosure Copyright © 2026. Algo Trading Systems LLC.