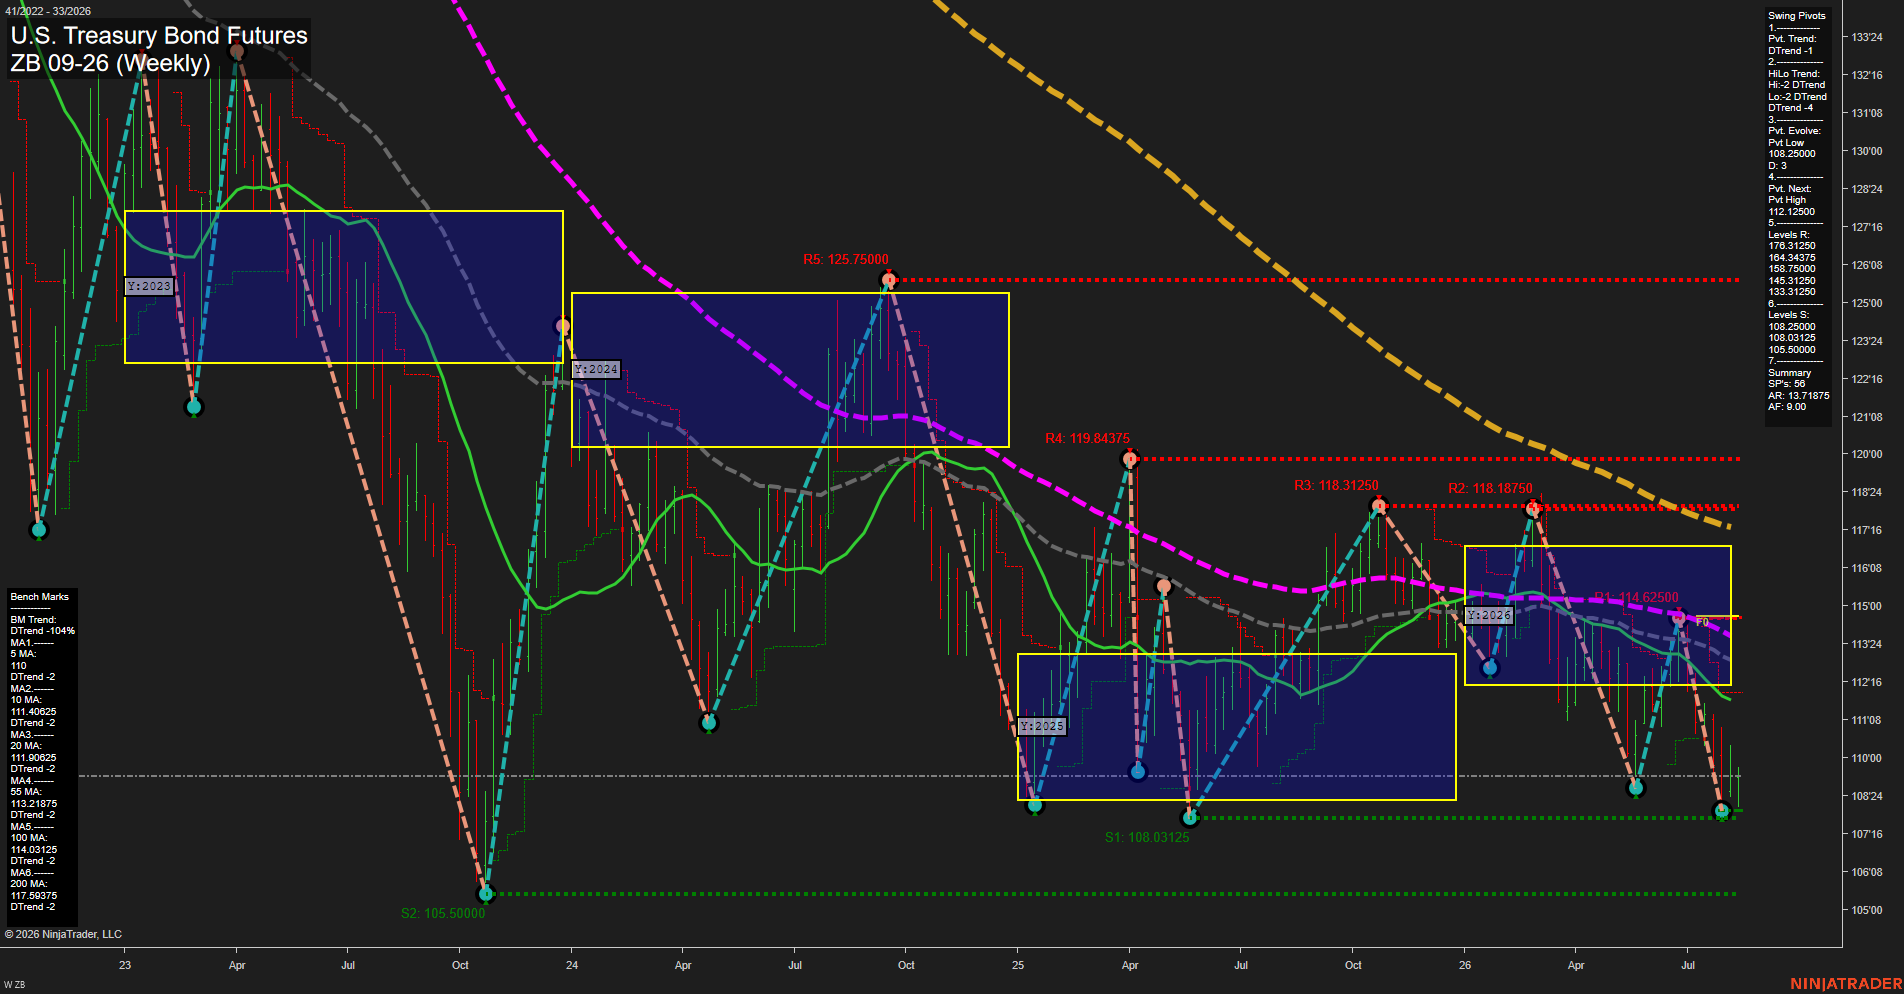
ZB U.S. Treasury Bond Futures Weekly Chart Analysis: 2026-Aug-12 07:13 CT
Price Action
- Last: 109.00000,
- Bars: Small,
- Mom: slow.
WSFG Weekly
- Short-Term
- WSFG Current: NA%
- F0%/NTZ' Bias: Price Below NTZ,
- WSFG Trend: Bearish.
MSFG Month Aug
- Intermediate-Term
- MSFG Current: NA%
- F0%/NTZ' Bias: Price Below NTZ,
- MSFG Trend: Bearish.
YSFG Year 2026
- Long-Term
- YSFG Current: NA%
- F0%/NTZ' Bias: Price Below NTZ,
- YSFG Trend: Bearish.
Swing Pivots
- (Short-Term) 1. Pvt. Trend: DTrend,
- (Intermediate-Term) 2. HiLo Trend: DTrend,
- 3. Pvt. Evolve: Pvt low 108.25000,
- 4. Pvt. Next: Pvt high 112.12500,
- 5. Levels R: 176.31250, 164.34375, 158.75000, 145.31250, 133.31250,
- 6. Levels S: 108.25000, 108.03125, 105.50000.
Weekly Benchmarks
- (Short-Term) 5 Day: 110.00000 Down Trend,
- (Short-Term) 10 Day: 111.40625 Down Trend,
- (Intermediate-Term) 20 Day: 111.90625 Down Trend,
- (Intermediate-Term) 55 Day: 113.21875 Down Trend,
- (Long-Term) 100 Day: 114.03125 Down Trend,
- (Long-Term) 200 Day: 117.59375 Down Trend.
Overall Rating
- Short-Term: Bearish,
- Intermediate-Term: Bearish,
- Long-Term: Bearish.
Key Insights Summary
The weekly structure remains broadly bearish: both pivot measures are in DTrend, price is positioned beneath the weekly, monthly, and yearly NTZ areas, and all benchmark averages are declining above price. The recent decline has compressed into smaller weekly bars around the 108.25000 to 108.03125 support area, indicating a slower downside phase and consolidation rather than a confirmed reversal. The 112.12500 next-pivot threshold defines the nearby structural recovery level, while the moving-average cluster from 110.00000 through 114.03125 reflects layered overhead pressure. The longer-term chart remains characterized by lower swing highs and lower swing lows.
Chart Analysis ATS AI Generated: 2026-08-12 07:13 for Informational use only, not trading advice. Terms and Risk Disclosure Copyright © 2026. Algo Trading Systems LLC.