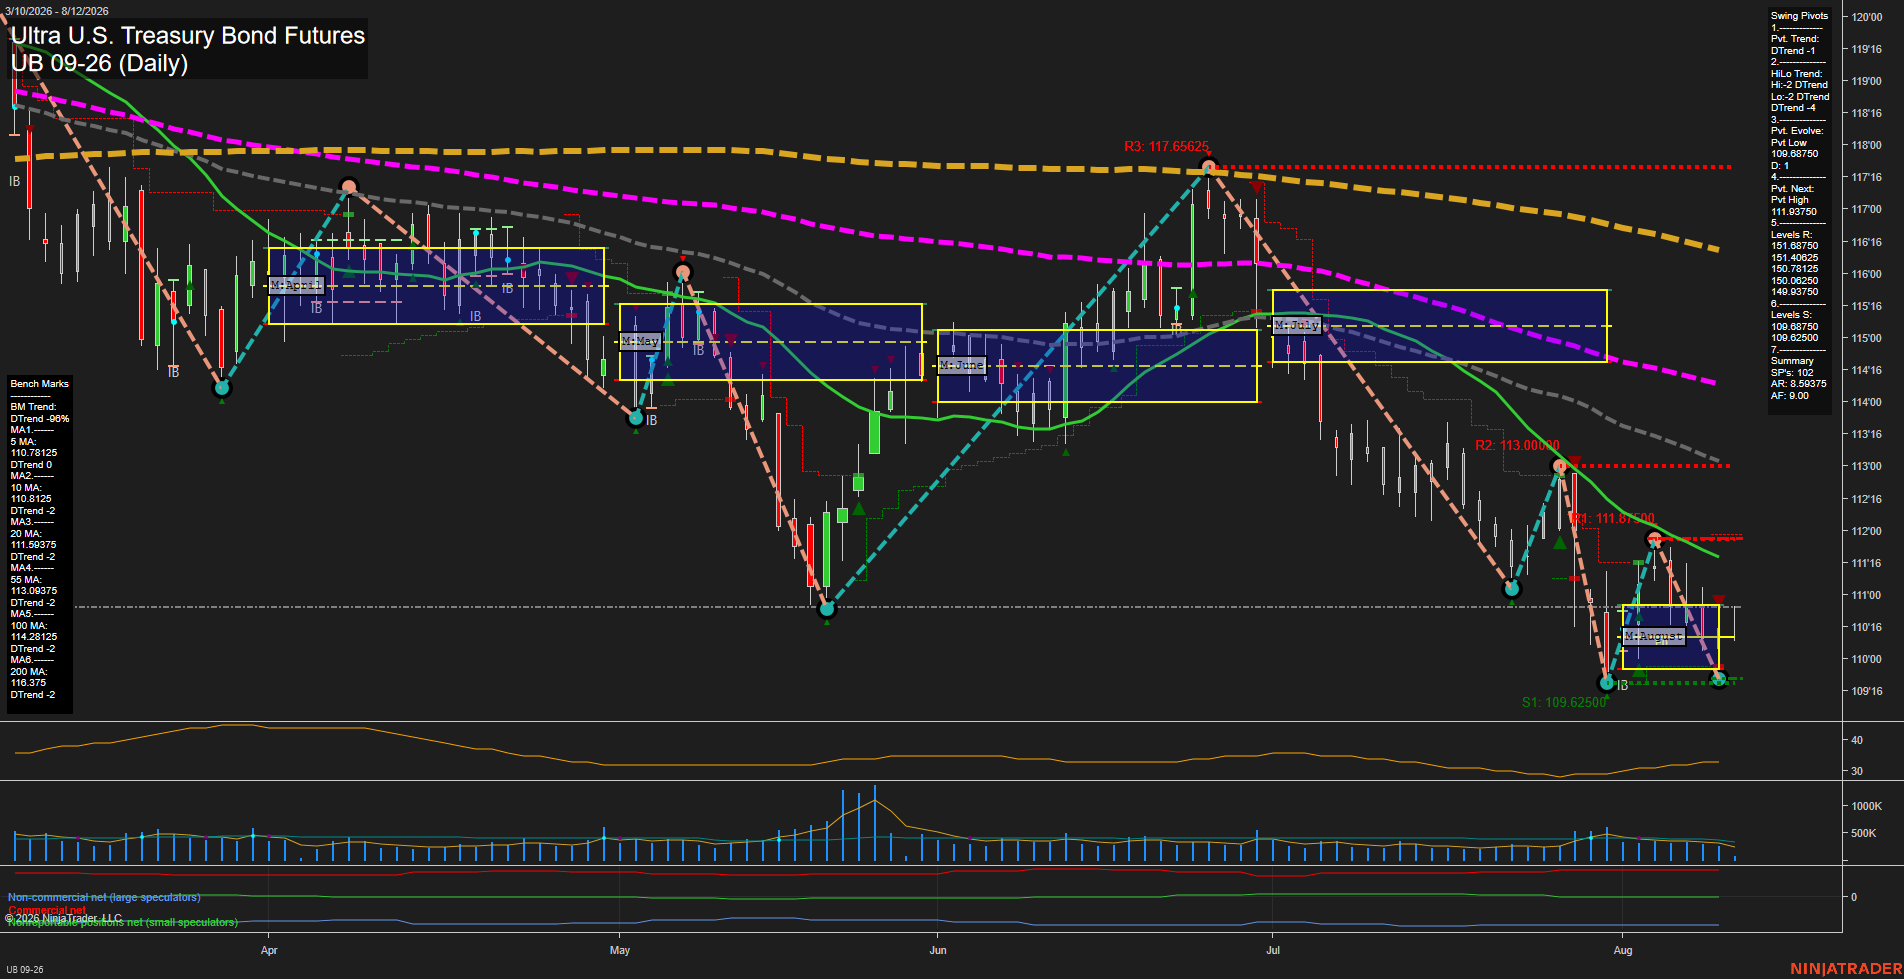
UB Ultra U.S. Treasury Bond Futures Daily Chart Analysis: 2026-Aug-12 07:11 CT
Price Action
- Last: 109.68750,
- Bars: Small,
- Mom: Slow.
WSFG Weekly
- Short-Term
- WSFG Current: -3%
- F0%/NTZ' Bias: Price Below,
- WSFG Trend: Down.
MSFG Month Aug
- Intermediate-Term
- MSFG Current: 9%
- F0%/NTZ' Bias: Price Above,
- MSFG Trend: Up.
YSFG Year 2026
- Long-Term
- YSFG Current: -18%
- F0%/NTZ' Bias: Price Below,
- YSFG Trend: Down.
Swing Pivots
- (Short-Term) 1. Pvt. Trend: DTrend,
- (Intermediate-Term) 2. HiLo Trend: DTrend,
- 3. Pvt. Evolve: Pvt low 109.68750,
- 4. Pvt. Next: Pvt high 111.93750,
- 5. Levels R: 117.65625, 113.00000, 111.87500,
- 6. Levels S: 109.68750, 109.62500.
Daily Benchmarks
- (Short-Term) 5 Day: 110.78125 Down Trend,
- (Short-Term) 10 Day: 110.81250 Down Trend,
- (Intermediate-Term) 20 Day: 111.59375 Down Trend,
- (Intermediate-Term) 55 Day: 113.09375 Down Trend,
- (Long-Term) 100 Day: 114.78125 Down Trend,
- (Long-Term) 200 Day: 116.37500 Down Trend.
Additional Metrics
Recent Trade Signals
- 11 Aug 2026: Short UB 09-26 @ 109.71875 Signals.USAR-MSFG
- 10 Aug 2026: Long UB 09-26 @ 110.90625 Signals.USAR-WSFG
- 06 Aug 2026: Short UB 09-26 @ 110.8125 Signals.USAR.TR120
Overall Rating
- Short-Term: Bearish,
- Intermediate-Term: Bearish,
- Long-Term: Bearish.
Key Insights Summary
UB remains in a broad bearish swing structure, with price below every daily benchmark and both pivot trend measures in DTrend. The August rally failed beneath the 111.87500 to 113.00000 resistance zone and was followed by a renewed selloff into the 109.68750 pivot-low area. Small recent bars and slowing momentum indicate consolidation near support after the decline, while the monthly grid remains positive as a countertrend intermediate-term retracement within the larger downtrend.
Chart Analysis ATS AI Generated: 2026-08-12 07:11 for Informational use only, not trading advice. Terms and Risk Disclosure Copyright © 2026. Algo Trading Systems LLC.