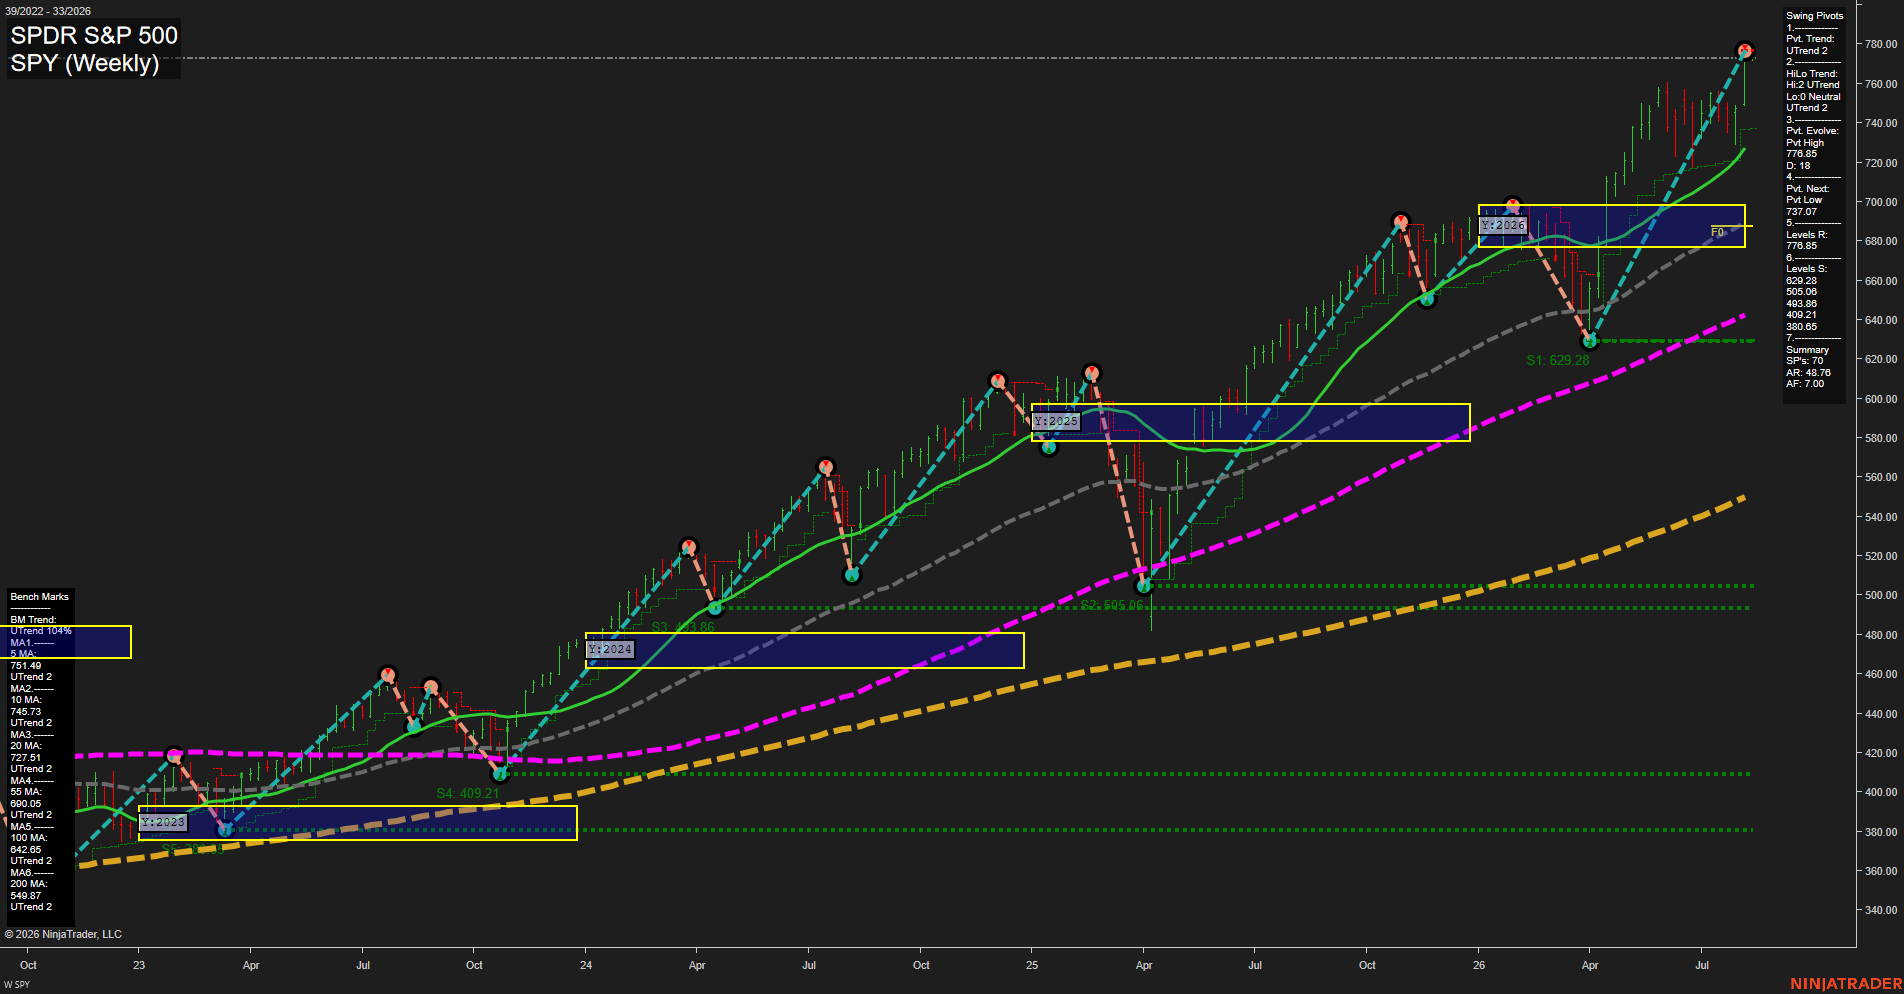
SPY SPDR S&P 500 Weekly Chart Analysis: 2026-Aug-11 07:10 CT
Price Action
- Last: 776.85,
- Bars: Medium,
- Mom: fast.
WSFG Weekly
- Short-Term
- WSFG Current: NA%
- F0%/NTZ' Bias: Price Above NTZ,
- WSFG Trend: Bullish.
MSFG Month Aug
- Intermediate-Term
- MSFG Current: NA%
- F0%/NTZ' Bias: Price Above NTZ,
- MSFG Trend: Bullish.
YSFG Year 2026
- Long-Term
- YSFG Current: NA%
- F0%/NTZ' Bias: Price Above NTZ,
- YSFG Trend: Bullish.
Swing Pivots
- (Short-Term) 1. Pvt. Trend: UTrend,
- (Intermediate-Term) 2. HiLo Trend: UTrend,
- 3. Pvt. Evolve: Pvt high 776.85,
- 4. Pvt. Next: Pvt low 737.07,
- 5. Levels R: 776.85,
- 6. Levels S: 629.28, 505.08, 493.38, 492.21, 380.65, 378.00.
Weekly Benchmarks
- (Short-Term) 5 Day: 751.49 Up Trend,
- (Short-Term) 10 Day: 745.73 Up Trend,
- (Intermediate-Term) 20 Day: 727.51 Up Trend,
- (Intermediate-Term) 55 Day: 690.05 Up Trend,
- (Long-Term) 100 Day: 642.65 Up Trend,
- (Long-Term) 200 Day: 548.97 Up Trend.
Overall Rating
- Short-Term: Bullish,
- Intermediate-Term: Bullish,
- Long-Term: Bullish.
Key Insights Summary
SPY’s weekly structure, used as a directional proxy for index futures, remains broadly bullish: price is pressing a new pivot high near 776.85 while all benchmark averages are rising and stacked beneath price. The advance has fast momentum and reflects trend continuation following the April V-recovery and subsequent sequence of higher highs and higher lows. The nearest structural pivot reference is 737.07; a move through that level would establish the next short-term pivot-low transition. The 2026 yearly NTZ near the 680-700 area is now well below price, highlighting an extended upside condition relative to the annual balance zone.
Chart Analysis ATS AI Generated: 2026-08-11 07:10 for Informational use only, not trading advice. Terms and Risk Disclosure Copyright © 2026. Algo Trading Systems LLC.