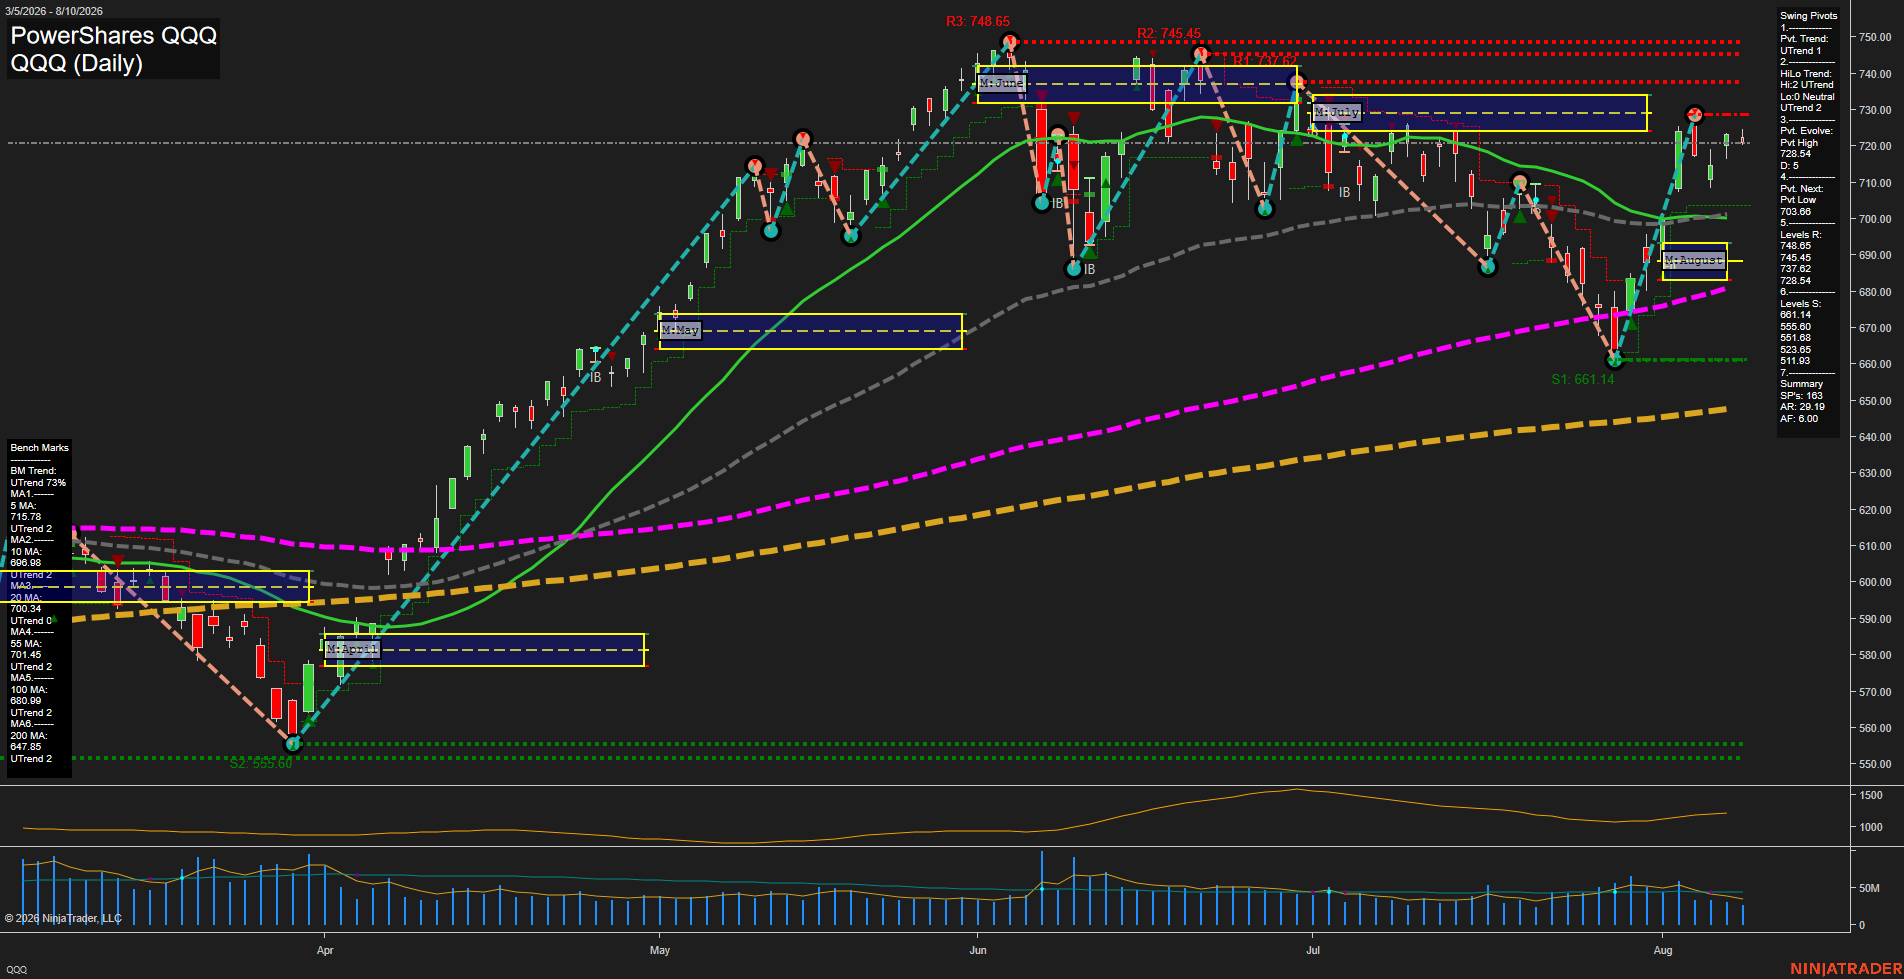
QQQ PowerShares QQQ Daily Chart Analysis: 2026-Aug-11 07:08 CT
Price Action
- Last: 721.43,
- Bars: Small,
- Mom: Slow.
WSFG Weekly
- Short-Term
- WSFG Current: NA%
- F0%/NTZ' Bias: Price Neutral,
- WSFG Trend: Neutral.
MSFG Month Aug
- Intermediate-Term
- MSFG Current: NA%
- F0%/NTZ' Bias: Price Above NTZ,
- MSFG Trend: UTrend.
YSFG Year 2026
- Long-Term
- YSFG Current: NA%
- F0%/NTZ' Bias: Price Neutral,
- YSFG Trend: UTrend.
Swing Pivots
- (Short-Term) 1. Pvt. Trend: UTrend,
- (Intermediate-Term) 2. HiLo Trend: UTrend,
- 3. Pvt. Evolve: Pvt high 728.54,
- 4. Pvt. Next: Pvt low 703.66,
- 5. Levels R: 748.65, 745.45, 737.62, 728.65,
- 6. Levels S: 681.14, 655.60, 551.68, 523.65, 511.93.
Daily Benchmarks
- (Short-Term) 5 Day: 715.78 Up Trend,
- (Short-Term) 10 Day: 696.98 Up Trend,
- (Intermediate-Term) 20 Day: 700.34 Up Trend,
- (Intermediate-Term) 55 Day: 701.45 Up Trend,
- (Long-Term) 100 Day: 680.96 Up Trend,
- (Long-Term) 200 Day: 647.85 Up Trend.
Additional Metrics
- ATR: 6.00,
- VOLMA: 32709273.
Overall Rating
- Short-Term: Bullish,
- Intermediate-Term: Bullish,
- Long-Term: Bullish.
Key Insights Summary
QQQ reflects a broad bullish futures-swing structure: price remains above all six rising daily benchmarks, while both short-term pivot trend and intermediate HiLo trend are UTrend. The late-July selloff found support near 661 and produced a sharp V-style recovery into the 720s. Current small bars and slowing momentum show consolidation beneath the 728.65 pivot resistance, with 737.62 through 748.65 defining the higher resistance band. The 703.66 next-pivot level and clustered 20/55-day averages near 700-701 form the principal intermediate retracement reference area. ATR at 6.00 indicates contained daily range conditions relative to the prior recovery impulse, while volume has moderated during the recent pause.
Chart Analysis ATS AI Generated: 2026-08-11 07:08 for Informational use only, not trading advice. Terms and Risk Disclosure Copyright © 2026. Algo Trading Systems LLC.