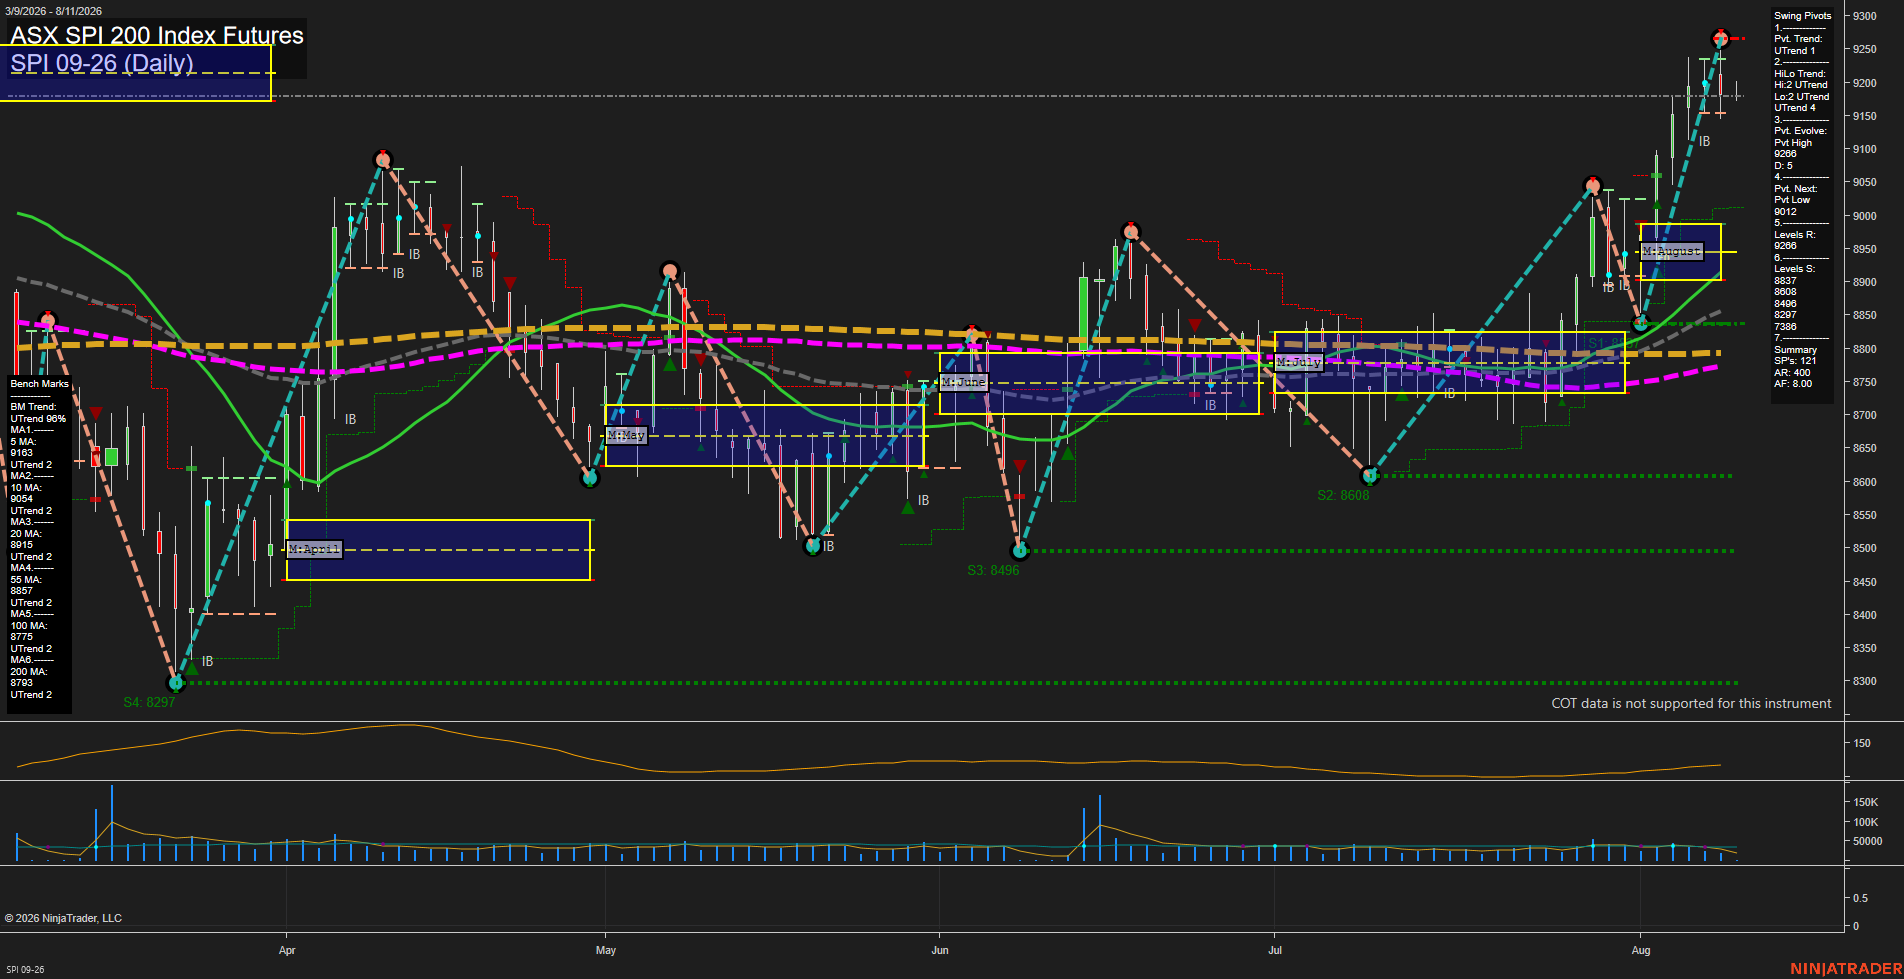
SPI ASX SPI 200 Index Futures Daily Chart Analysis: 2026-Aug-10 07:09 CT
Price Action
- Last: 9163,
- Bars: Medium,
- Mom: fast.
WSFG Weekly
- Short-Term
- WSFG Current: NA%
- F0%/NTZ' Bias: Price Bullish,
- WSFG Trend: Bullish.
MSFG Month Aug
- Intermediate-Term
- MSFG Current: NA%
- F0%/NTZ' Bias: Price Bullish,
- MSFG Trend: Bullish.
YSFG Year 2026
- Long-Term
- YSFG Current: NA%
- F0%/NTZ' Bias: Price Bullish,
- YSFG Trend: Bullish.
Swing Pivots
- (Short-Term) 1. Pvt. Trend: UTrend,
- (Intermediate-Term) 2. HiLo Trend: UTrend,
- 3. Pvt. Evolve: Pvt high 9266,
- 4. Pvt. Next: Pvt low 9012,
- 5. Levels R: 9266,
- 6. Levels S: 8837, 8808, 8496, 8297.
Daily Benchmarks
- (Short-Term) 5 Day: 9163 Up Trend,
- (Short-Term) 10 Day: 9054 Up Trend,
- (Intermediate-Term) 20 Day: 8915 Up Trend,
- (Intermediate-Term) 55 Day: 8857 Up Trend,
- (Long-Term) 100 Day: 8775 Up Trend,
- (Long-Term) 200 Day: 8793 Up Trend.
Additional Metrics
Overall Rating
- Short-Term: Bullish,
- Intermediate-Term: Bullish,
- Long-Term: Bullish.
Key Insights Summary
The SPI daily structure is broadly bullish, with price accelerating above the entire benchmark moving-average stack and holding a sequence of higher pivot lows. Short-term momentum is fast following the sharp August advance, while the current evolving pivot high at 9266 defines the immediate upside swing reference. The 9012 pivot-next level is the key short-term reversal threshold, with deeper swing supports clustered at 8837 and 8808 near the intermediate moving-average zone. Price is extended above the August monthly grid and recent volume has moderated relative to the initial rally impulse, characterizing an advancing but increasingly stretched upswing rather than a broad consolidation.
Chart Analysis ATS AI Generated: 2026-08-10 07:09 for Informational use only, not trading advice. Terms and Risk Disclosure Copyright © 2026. Algo Trading Systems LLC.