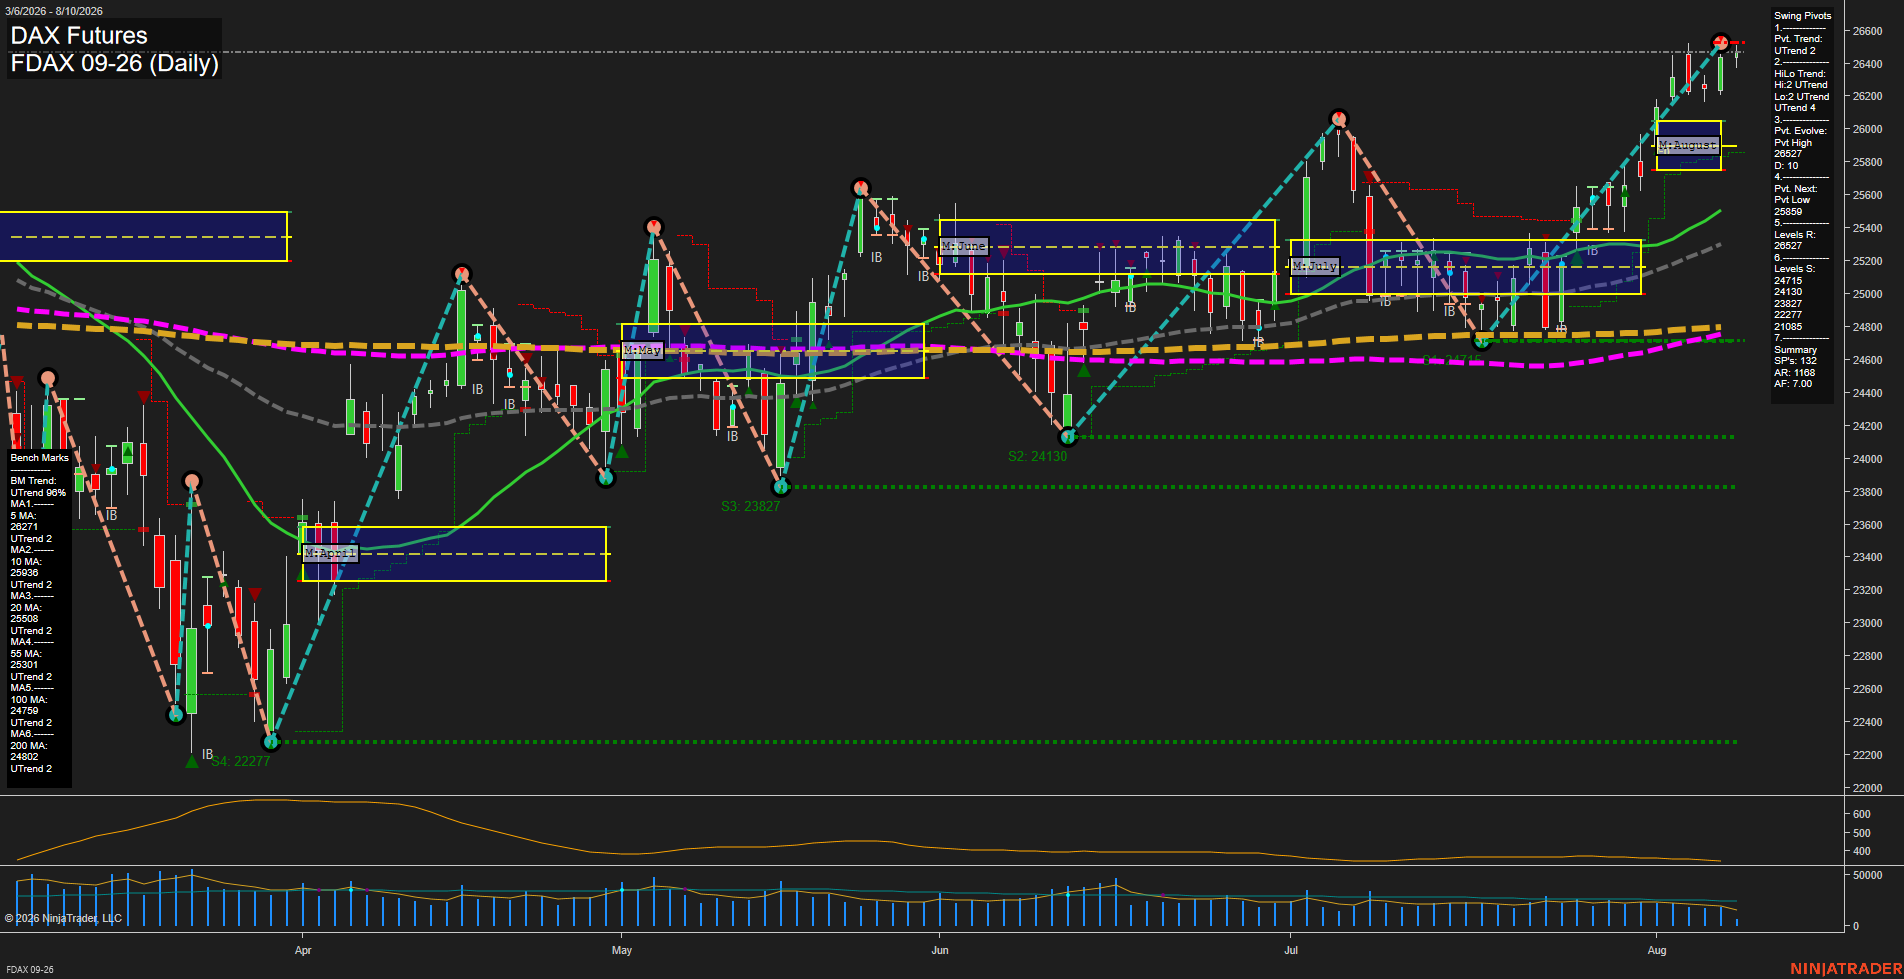
FDAX DAX Futures Daily Chart Analysis: 2026-Aug-10 07:04 CT
Price Action
- Last: 26527,
- Bars: Medium,
- Mom: fast.
WSFG Weekly
- Short-Term
- WSFG Current: 6%
- F0%/NTZ' Bias: Price Above,
- WSFG Trend: Up.
MSFG Month Aug
- Intermediate-Term
- MSFG Current: 39%
- F0%/NTZ' Bias: Price Above,
- MSFG Trend: Up.
YSFG Year 2026
- Long-Term
- YSFG Current: 45%
- F0%/NTZ' Bias: Price Above,
- YSFG Trend: Up.
Swing Pivots
- (Short-Term) 1. Pvt. Trend: UTrend,
- (Intermediate-Term) 2. HiLo Trend: UTrend,
- 3. Pvt. Evolve: Pvt high 26527,
- 4. Pvt. Next: Pvt low 25859,
- 5. Levels R: 26527,
- 6. Levels S: 24715, 24130, 23827, 22277.
Daily Benchmarks
- (Short-Term) 5 Day: 26271 Up Trend,
- (Short-Term) 10 Day: 25936 Up Trend,
- (Intermediate-Term) 20 Day: 25508 Up Trend,
- (Intermediate-Term) 55 Day: 25301 Up Trend,
- (Long-Term) 100 Day: 24759 Up Trend,
- (Long-Term) 200 Day: 24802 Up Trend.
Additional Metrics
Recent Trade Signals
- 06 Aug 2026: Short FDAX 09-26 @ 26201 Signals.USAR.TR120
- 04 Aug 2026: Long FDAX 09-26 @ 26213 Signals.USAR-MSFG
Overall Rating
- Short-Term: Bullish,
- Intermediate-Term: Bullish,
- Long-Term: Bullish.
Key Insights Summary
FDAX is in a broadly aligned daily uptrend, with price above all benchmark averages and each average trending higher. The August monthly and weekly fib structures remain positive, while the pivot sequence continues to show higher lows and a newly established pivot high at 26527. Fast upside momentum has carried price into the 26527 resistance area following a sharp July-to-August advance, creating a near-term extension phase. The 25859 pivot-reversal level is the key short-term structural reference, while the 25508 20-day benchmark and 25301 55-day benchmark define the deeper intermediate trend support zone.
Chart Analysis ATS AI Generated: 2026-08-10 07:04 for Informational use only, not trading advice. Terms and Risk Disclosure Copyright © 2026. Algo Trading Systems LLC.