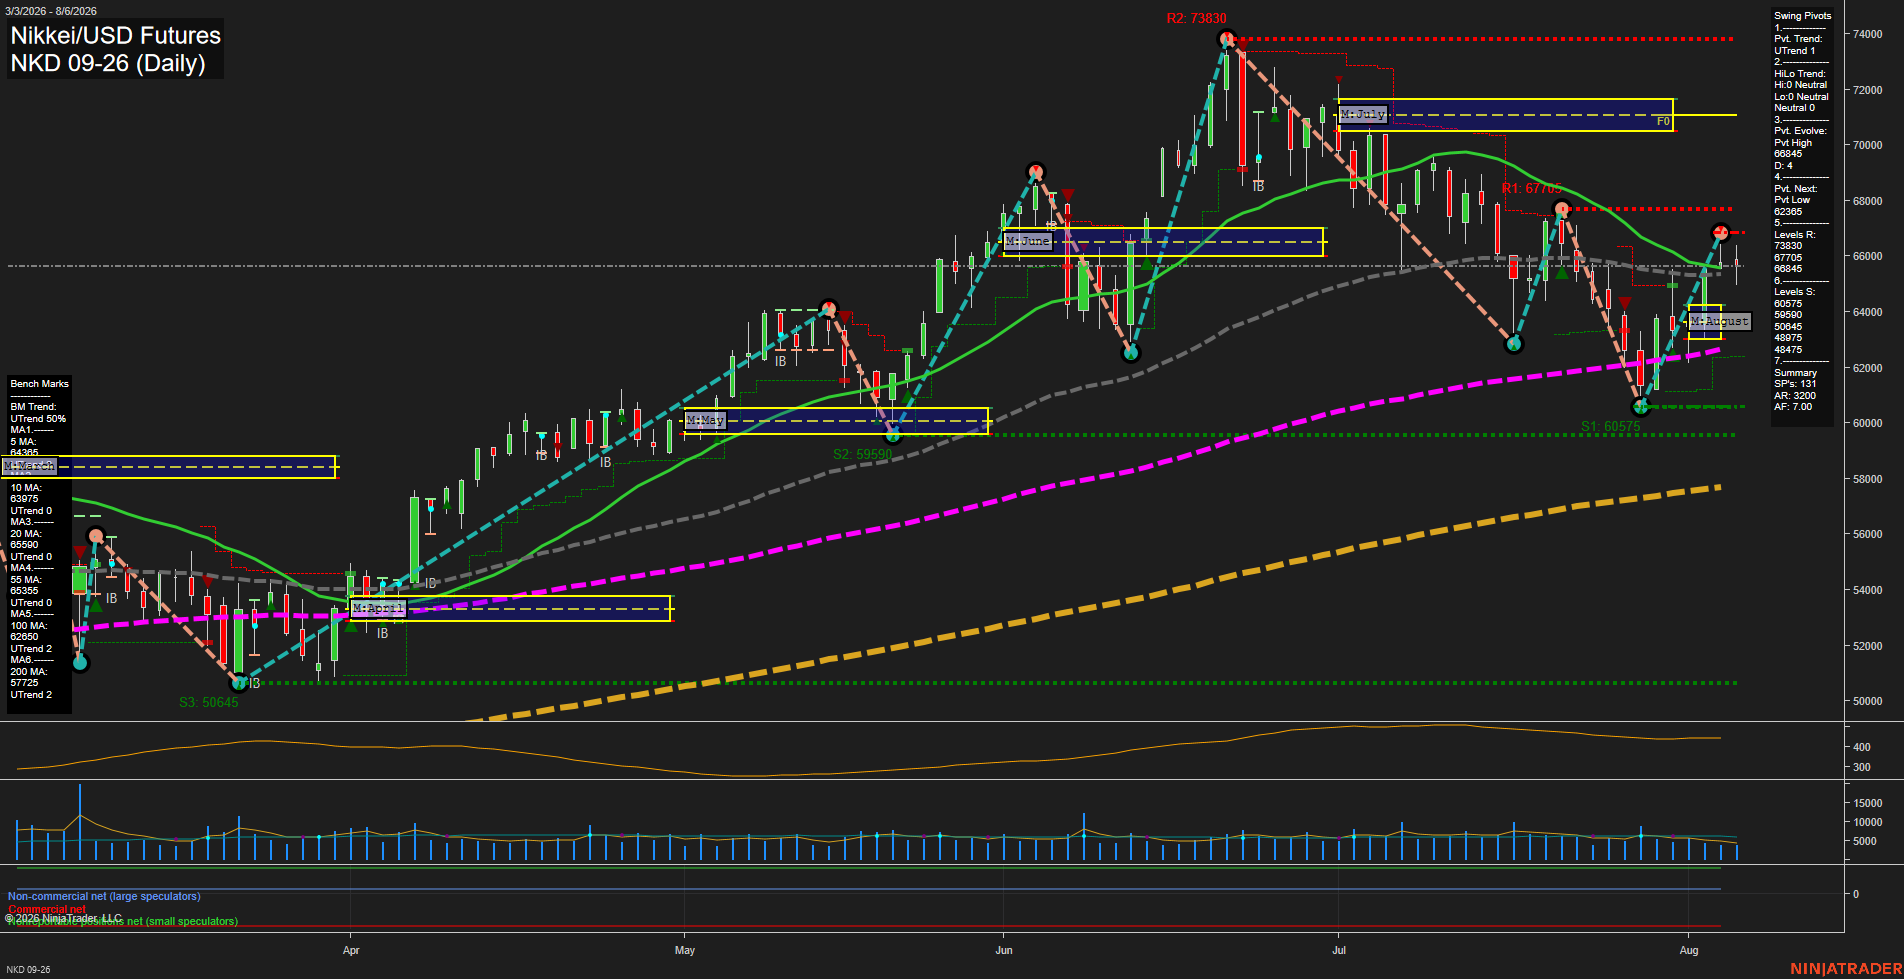
NKD Nikkei/USD Futures Daily Chart Analysis: 2026-Aug-07 07:06 CT
Price Action
- Last: 65980,
- Bars: Small,
- Mom: Average.
WSFG Weekly
- Short-Term
- WSFG Current: 50%
- F0%/NTZ' Bias: Price Above,
- WSFG Trend: Up.
MSFG Month Aug
- Intermediate-Term
- MSFG Current: 27%
- F0%/NTZ' Bias: Price Above,
- MSFG Trend: Up.
YSFG Year 2026
- Long-Term
- YSFG Current: 180%
- F0%/NTZ' Bias: Price Above,
- YSFG Trend: Up.
Swing Pivots
- (Short-Term) 1. Pvt. Trend: UTrend,
- (Intermediate-Term) 2. HiLo Trend: Neutral,
- 3. Pvt. Evolve: Pvt high 66845,
- 4. Pvt. Next: Pvt low 62305,
- 5. Levels R: 73830, 67705, 66845,
- 6. Levels S: 60575, 59590, 50645, 48975, 48445.
Daily Benchmarks
- (Short-Term) 5 Day: 64385 Up Trend,
- (Short-Term) 10 Day: 63975 Up Trend,
- (Intermediate-Term) 20 Day: 65590 Up Trend,
- (Intermediate-Term) 55 Day: 65355 Up Trend,
- (Long-Term) 100 Day: 62655 Up Trend,
- (Long-Term) 200 Day: 57725 Up Trend.
Additional Metrics
Recent Trade Signals
- 04 Aug 2026: Long NKD 09-26 @ 64485 Signals.USAR-WSFG
Overall Rating
- Short-Term: Bullish,
- Intermediate-Term: Bullish,
- Long-Term: Bullish.
Key Insights Summary
NKD has recovered from the late-July pullback and is holding above the rising 20-day and 55-day benchmarks, restoring a constructive swing structure. The short-term pivot trend is up, while the intermediate pivot structure remains neutral following the retreat from the July peak near 73830. Price is consolidating beneath the 66845 to 67705 resistance band after a sharp V-style rebound; 65590 and 65355 are the nearest moving-average support cluster, followed by the major pivot supports at 60575 and 59590. Long-term alignment remains positive, with price materially above the rising 100-day and 200-day averages and the yearly fib structure still in an uptrend.
Chart Analysis ATS AI Generated: 2026-08-07 07:06 for Informational use only, not trading advice. Terms and Risk Disclosure Copyright © 2026. Algo Trading Systems LLC.