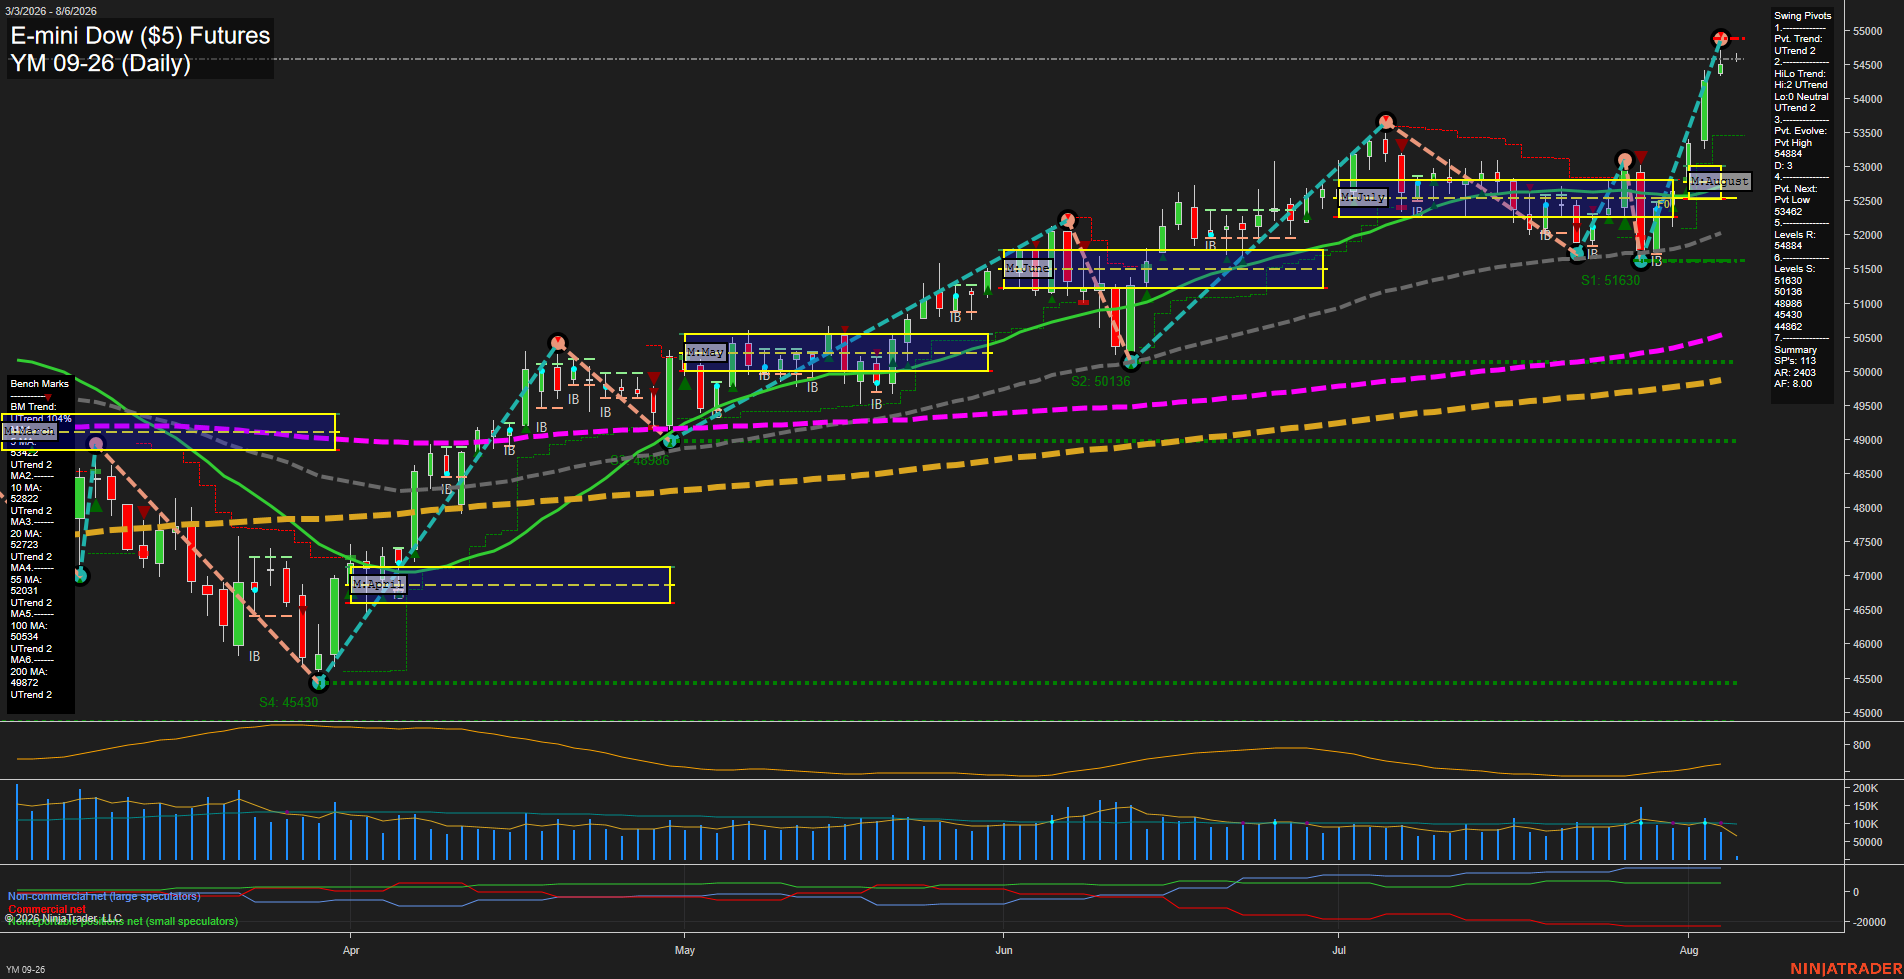
YM E-mini Dow ($5) Futures Daily Chart Analysis: 2026-Aug-06 07:11 CT
Price Action
- Last: 54884,
- Bars: Large,
- Mom: fast.
WSFG Weekly
- Short-Term
- WSFG Current: 153%
- F0%/NTZ' Bias: Price Above,
- WSFG Trend: Up.
MSFG Month Aug
- Intermediate-Term
- MSFG Current: 74%
- F0%/NTZ' Bias: Price Above,
- MSFG Trend: Up.
YSFG Year 2026
- Long-Term
- YSFG Current: 68%
- F0%/NTZ' Bias: Price Above,
- YSFG Trend: Up.
Swing Pivots
- (Short-Term) 1. Pvt. Trend: UTrend,
- (Intermediate-Term) 2. HiLo Trend: UTrend,
- 3. Pvt. Evolve: Pvt high 54884,
- 4. Pvt. Next: Pvt low 53402,
- 5. Levels R: 54884,
- 6. Levels S: 51630, 50136, 48986, 45430, 44862.
Daily Benchmarks
- (Short-Term) 5 Day: 54190 Up Trend,
- (Short-Term) 10 Day: 52822 Up Trend,
- (Intermediate-Term) 20 Day: 52728 Up Trend,
- (Intermediate-Term) 55 Day: 52031 Up Trend,
- (Long-Term) 100 Day: 50533 Up Trend,
- (Long-Term) 200 Day: 49872 Up Trend.
Additional Metrics
Recent Trade Signals
- 03 Aug 2026: Long YM 09-26 @ 53172 Signals.USAR-MSFG
- 03 Aug 2026: Long YM 09-26 @ 52953 Signals.USAR-WSFG
- 30 Jul 2026: Long YM 09-26 @ 52379 Signals.USAR.TR120
Overall Rating
- Short-Term: Bullish,
- Intermediate-Term: Bullish,
- Long-Term: Bullish.
Key Insights Summary
YM is in a broad, synchronized upswing: price is above the weekly, monthly, and yearly Fib-grid centers and all six benchmark averages are rising. The latest large-range advance has produced a new 54884 pivot high, confirming the short-term UTrend within the intermediate HiLo UTrend. Momentum is fast and price is materially extended above the 10-day and 20-day averages, while 53402 is the defined opposite-pivot level beneath the recent breakout sequence. The rally has maintained higher highs and higher lows since the spring reversal, with the 51630 support zone representing the nearest major swing structure below current price.
Chart Analysis ATS AI Generated: 2026-08-06 07:11 for Informational use only, not trading advice. Terms and Risk Disclosure Copyright © 2026. Algo Trading Systems LLC.