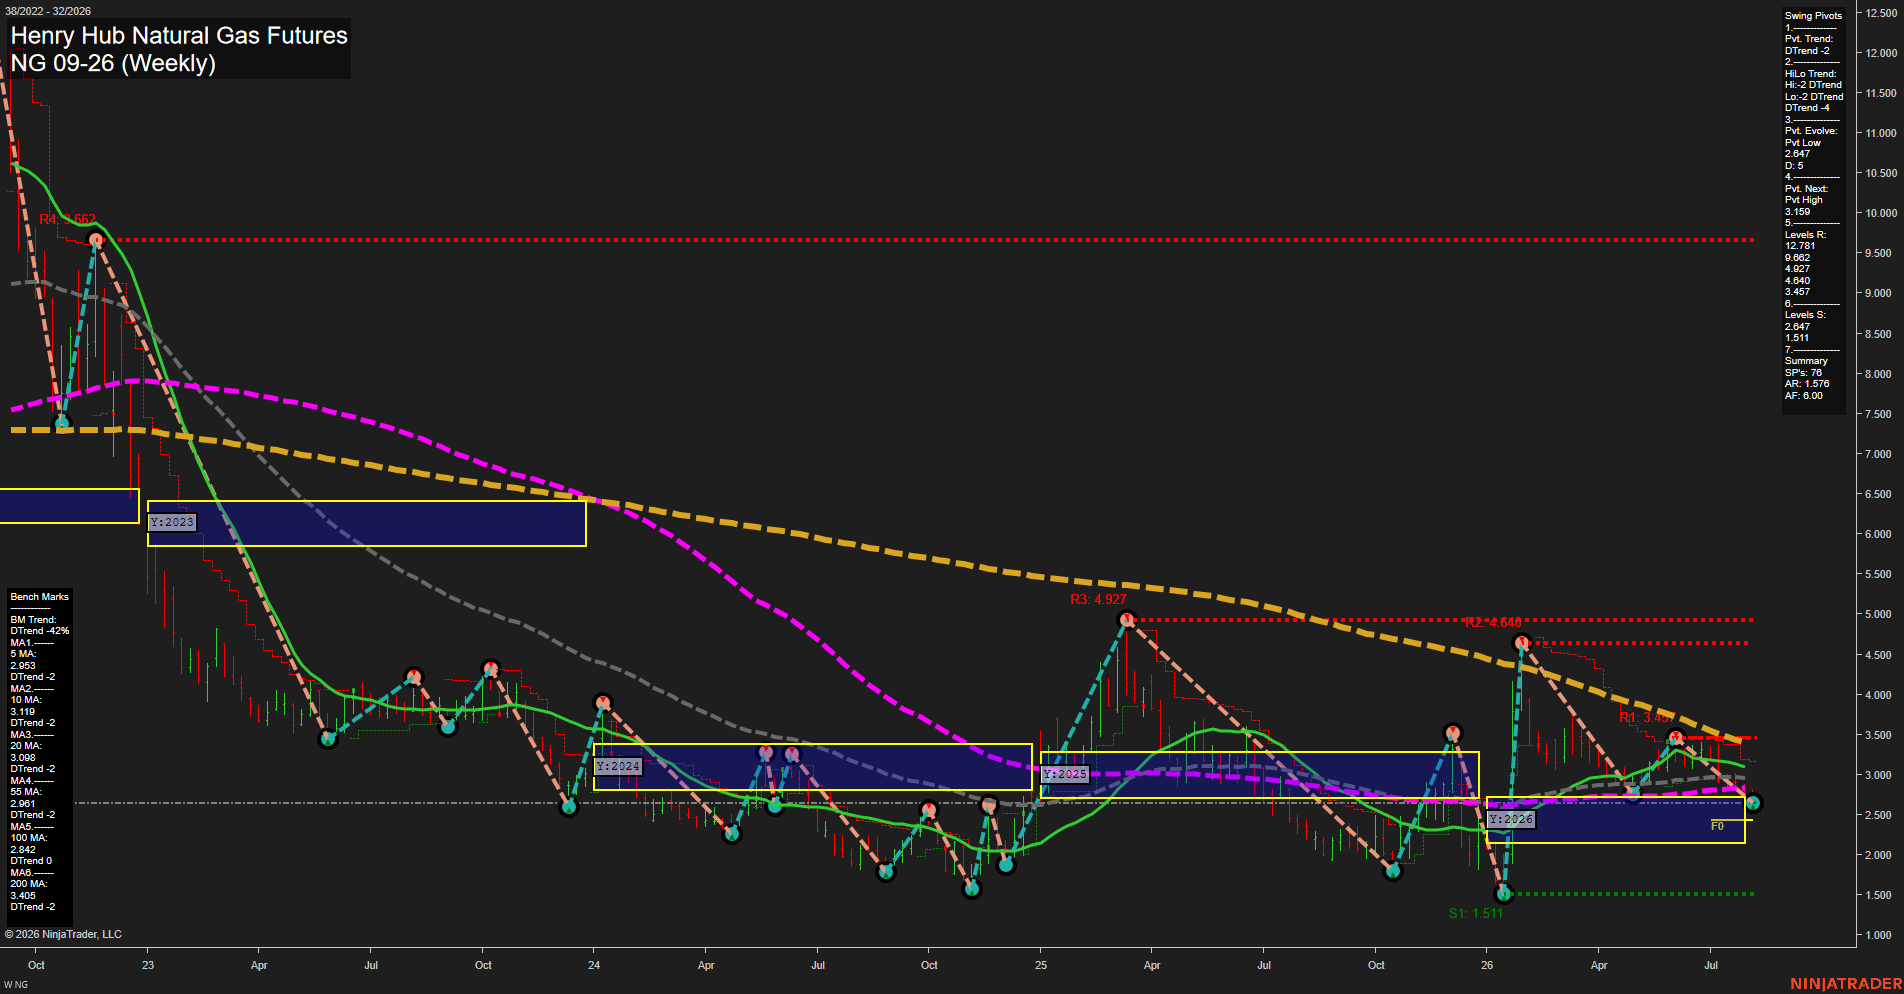
NG Henry Hub Natural Gas Futures Weekly Chart Analysis: 2026-Aug-06 07:07 CT
Price Action
- Last: 2.674,
- Bars: Small,
- Mom: slow.
WSFG Weekly
- Short-Term
- WSFG Current: -39%
- F0%/NTZ' Bias: Price Below,
- WSFG Trend: Down.
MSFG Month Aug
- Intermediate-Term
- MSFG Current: -19%
- F0%/NTZ' Bias: Price Below,
- MSFG Trend: Down.
YSFG Year 2026
- Long-Term
- YSFG Current: 8%
- F0%/NTZ' Bias: Price Above,
- YSFG Trend: Up.
Swing Pivots
- (Short-Term) 1. Pvt. Trend: DTrend,
- (Intermediate-Term) 2. HiLo Trend: DTrend,
- 3. Pvt. Evolve: Pvt low 2.647,
- 4. Pvt. Next: Pvt high 3.159,
- 5. Levels R: 12.781, 9.662, 4.927, 4.640, 3.457,
- 6. Levels S: 2.647, 1.511.
Weekly Benchmarks
- (Short-Term) 5 Day: 2.953 Down Trend,
- (Short-Term) 10 Day: 3.119 Down Trend,
- (Intermediate-Term) 20 Day: 3.098 Down Trend,
- (Intermediate-Term) 55 Day: 2.961 Down Trend,
- (Long-Term) 100 Day: 2.842 Down Trend,
- (Long-Term) 200 Day: 3.408 Down Trend.
Recent Trade Signals
- 06 Aug 2026: Short NG 09-26 @ 2.674 Signals.USAR-MSFG
- 04 Aug 2026: Short NG 09-26 @ 2.664 Signals.USAR.TR120
- 04 Aug 2026: Short NG 09-26 @ 2.705 Signals.USAR-WSFG
Overall Rating
- Short-Term: Bearish,
- Intermediate-Term: Bearish,
- Long-Term: Bearish.
Key Insights Summary
NG remains in a broad bearish swing structure, with price below all six declining benchmarks and both short-term pivot trend and intermediate HiLo trend in DTrend. Small weekly bars and slow momentum reflect compression near the 2.647 pivot-low support after a failed recovery from the early-2026 low. The 3.159 pivot-next level is the nearby upside reversal threshold, while 3.457 is the first larger swing resistance. The yearly grid remains marginally positive, but the weekly and monthly grids are below F0% and the recent short signals align with the prevailing downside structure.
Chart Analysis ATS AI Generated: 2026-08-06 07:07 for Informational use only, not trading advice. Terms and Risk Disclosure Copyright © 2026. Algo Trading Systems LLC.