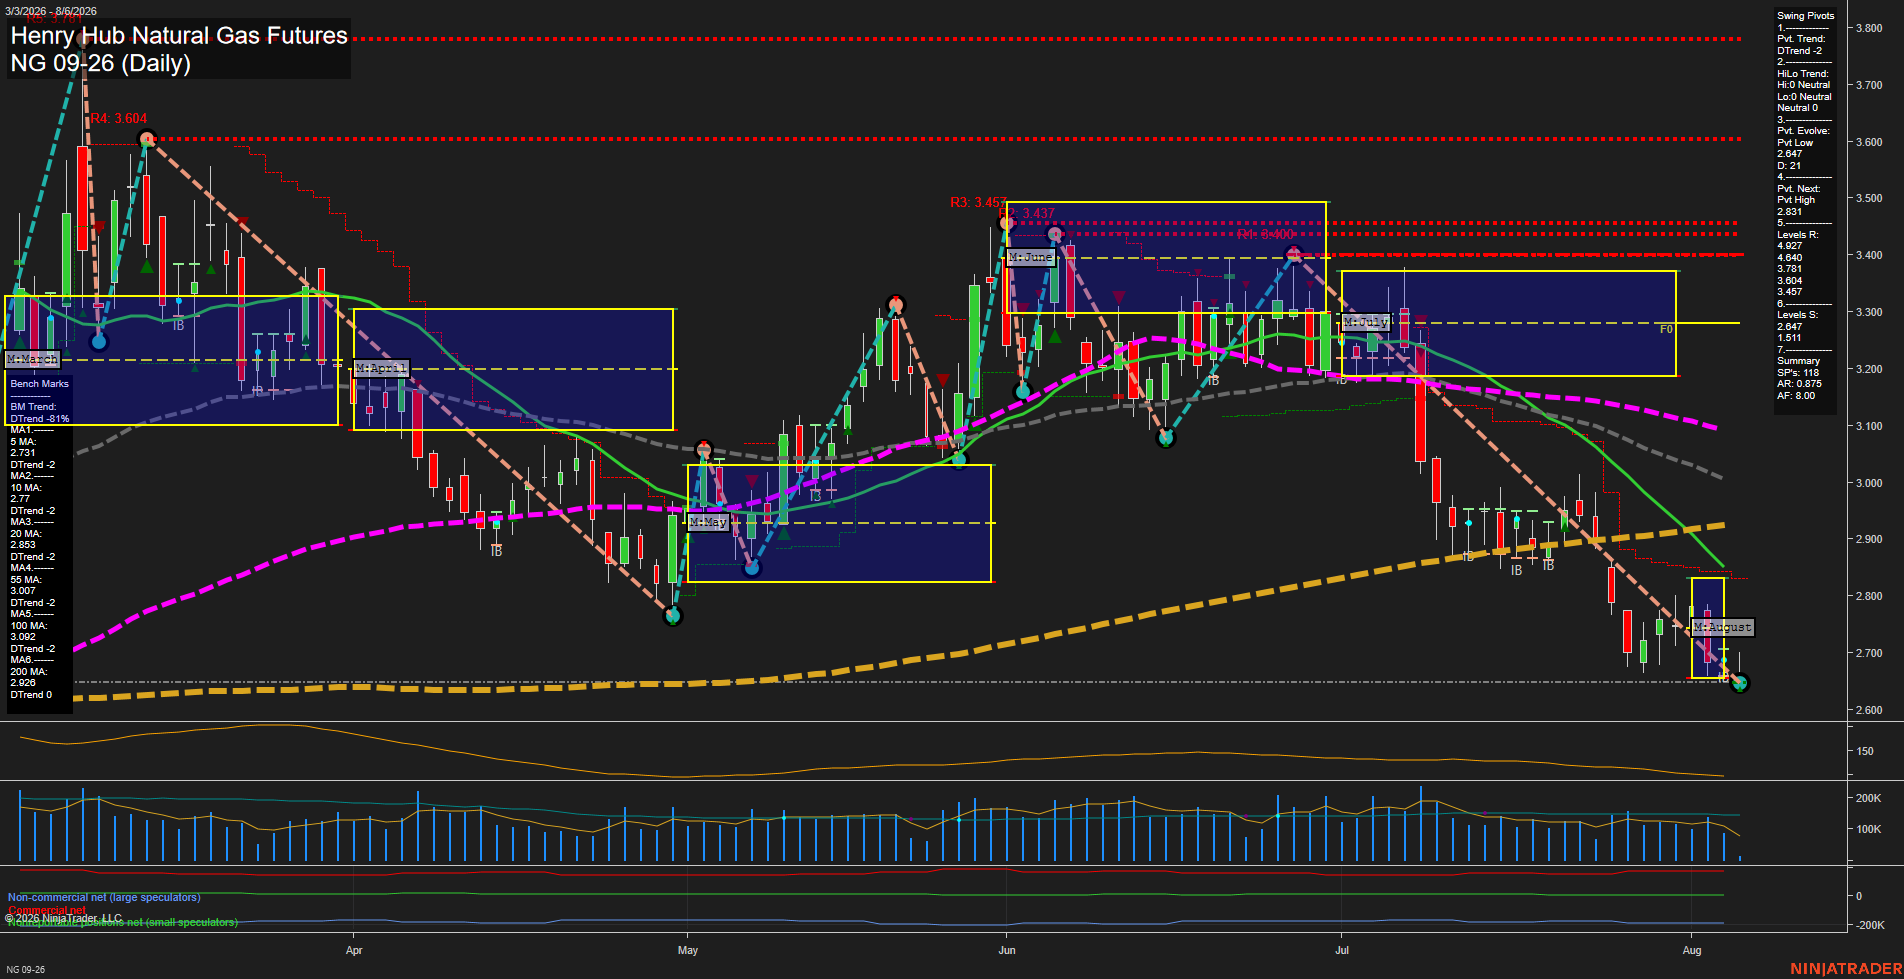
NG Henry Hub Natural Gas Futures Daily Chart Analysis: 2026-Aug-06 07:06 CT
Price Action
- Last: 2.647,
- Bars: Small,
- Mom: Momentum slow.
WSFG Weekly
- Short-Term
- WSFG Current: -39%
- F0%/NTZ' Bias: Price Below,
- WSFG Trend: Down.
MSFG Month Aug
- Intermediate-Term
- MSFG Current: -19%
- F0%/NTZ' Bias: Price Below,
- MSFG Trend: Down.
YSFG Year 2026
- Long-Term
- YSFG Current: 8%
- F0%/NTZ' Bias: Price Above,
- YSFG Trend: Up.
Swing Pivots
- (Short-Term) 1. Pvt. Trend: DTrend,
- (Intermediate-Term) 2. HiLo Trend: DTrend,
- 3. Pvt. Evolve: Pvt low 2.647,
- 4. Pvt. Next: Pvt high 2.831,
- 5. Levels R: 4.940, 4.607, 3.781, 3.681, 3.467,
- 6. Levels S: 2.647, 1.511.
Daily Benchmarks
- (Short-Term) 5 Day: 2.734 Down Trend,
- (Short-Term) 10 Day: 2.777 Down Trend,
- (Intermediate-Term) 20 Day: 2.854 Down Trend,
- (Intermediate-Term) 55 Day: 3.007 Down Trend,
- (Long-Term) 100 Day: 3.092 Down Trend,
- (Long-Term) 200 Day: 2.926 Down Trend.
Additional Metrics
Recent Trade Signals
- 06 Aug 2026: Short NG 09-26 @ 2.674 Signals.USAR-MSFG
- 04 Aug 2026: Short NG 09-26 @ 2.664 Signals.USAR.TR120
- 04 Aug 2026: Short NG 09-26 @ 2.705 Signals.USAR-WSFG
Overall Rating
- Short-Term: Bearish,
- Intermediate-Term: Bearish,
- Long-Term: Neutral.
Key Insights Summary
NG remains in a broad daily downswing, with price beneath every benchmark average and both weekly and monthly session grids below their F0% levels. The decline has extended into the 2.647 pivot-low area, where smaller bars and slowing momentum reflect a short-term stabilization attempt after the sharp July selloff. The pivot structure remains bearish, defined by lower highs and lower lows, while 2.831 is the first opposing pivot threshold. The yearly grid remains positive, creating a longer-term countertrend backdrop despite the currently negative daily and intermediate-term structure.
Chart Analysis ATS AI Generated: 2026-08-06 07:06 for Informational use only, not trading advice. Terms and Risk Disclosure Copyright © 2026. Algo Trading Systems LLC.