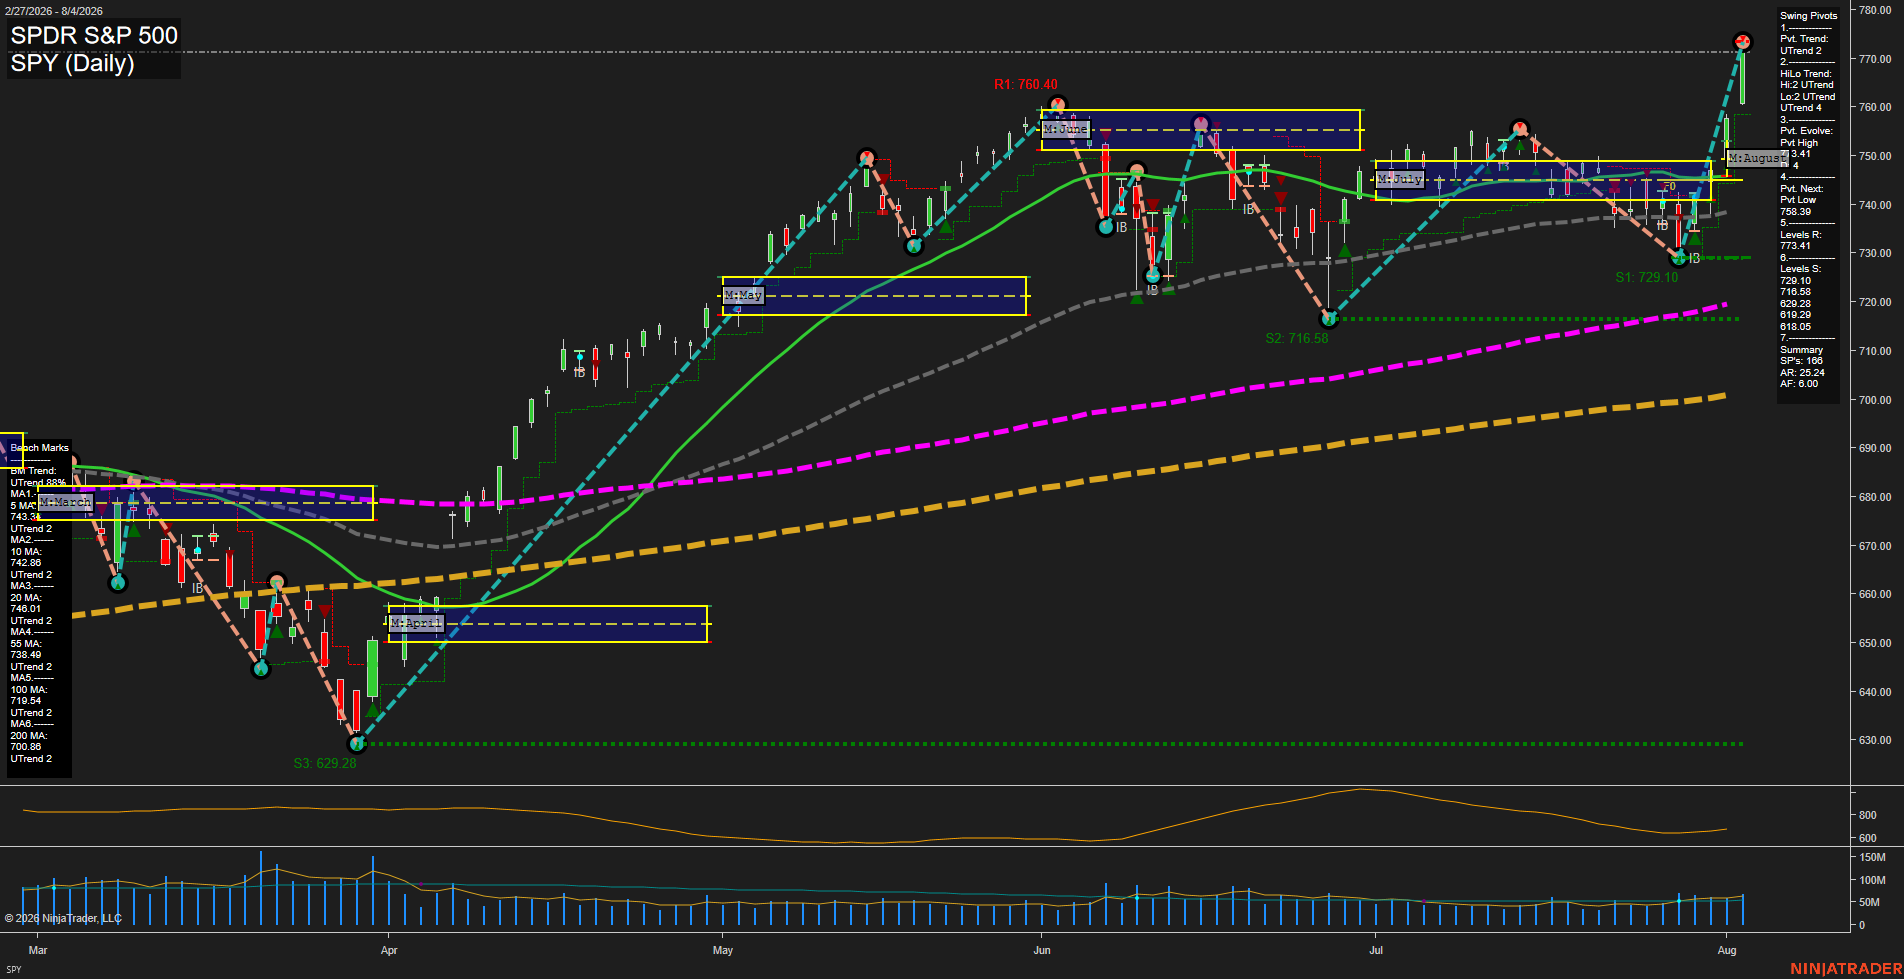
SPY SPDR S&P 500 Daily Chart Analysis: 2026-Aug-05 07:09 CT
Price Action
- Last: 771.80,
- Bars: Large,
- Mom: fast.
WSFG Weekly
- Short-Term
- WSFG Current: NA%
- F0%/NTZ' Bias: Price Bullish,
- WSFG Trend: UTrend.
MSFG Month Aug
- Intermediate-Term
- MSFG Current: NA%
- F0%/NTZ' Bias: Price Bullish,
- MSFG Trend: UTrend.
YSFG Year 2026
- Long-Term
- YSFG Current: NA%
- F0%/NTZ' Bias: Price Bullish,
- YSFG Trend: UTrend.
Swing Pivots
- (Short-Term) 1. Pvt. Trend: UTrend,
- (Intermediate-Term) 2. HiLo Trend: UTrend,
- 3. Pvt. Evolve: Pvt high 773.41,
- 4. Pvt. Next: Pvt low 753.39,
- 5. Levels R: 773.41, 759.41,
- 6. Levels S: 728.10, 716.58, 692.98, 619.29, 618.05.
Daily Benchmarks
- (Short-Term) 5 Day: 743.31 Up Trend,
- (Short-Term) 10 Day: 742.86 Up Trend,
- (Intermediate-Term) 20 Day: 746.00 Up Trend,
- (Intermediate-Term) 55 Day: 738.49 Up Trend,
- (Long-Term) 100 Day: 719.54 Up Trend,
- (Long-Term) 200 Day: 700.86 Up Trend.
Additional Metrics
- ATR: 25.24,
- VOLMA: 43000000.
Overall Rating
- Short-Term: Bullish,
- Intermediate-Term: Bullish,
- Long-Term: Bullish.
Key Insights Summary
The futures swing-trader view is broadly trend-positive: price has accelerated from the late-July pullback and is pressing the 773.41 pivot-high resistance area with large-range upside price action. The pivot structure remains in synchronized short- and intermediate-term UTrends, while price is above all six rising benchmark averages. The 753.39 pivot-next level defines the nearest structural reversal reference; beneath it, the 746.00 to 738.49 moving-average band and 728.10 pivot support are the principal pullback structure. Recent trend signals and the weekly, monthly, and yearly grid positioning align with the prevailing upside continuation cycle, although the expanded 25.24 ATR reflects a more volatile futures-style swing environment.
Chart Analysis ATS AI Generated: 2026-08-05 07:09 for Informational use only, not trading advice. Terms and Risk Disclosure Copyright © 2026. Algo Trading Systems LLC.