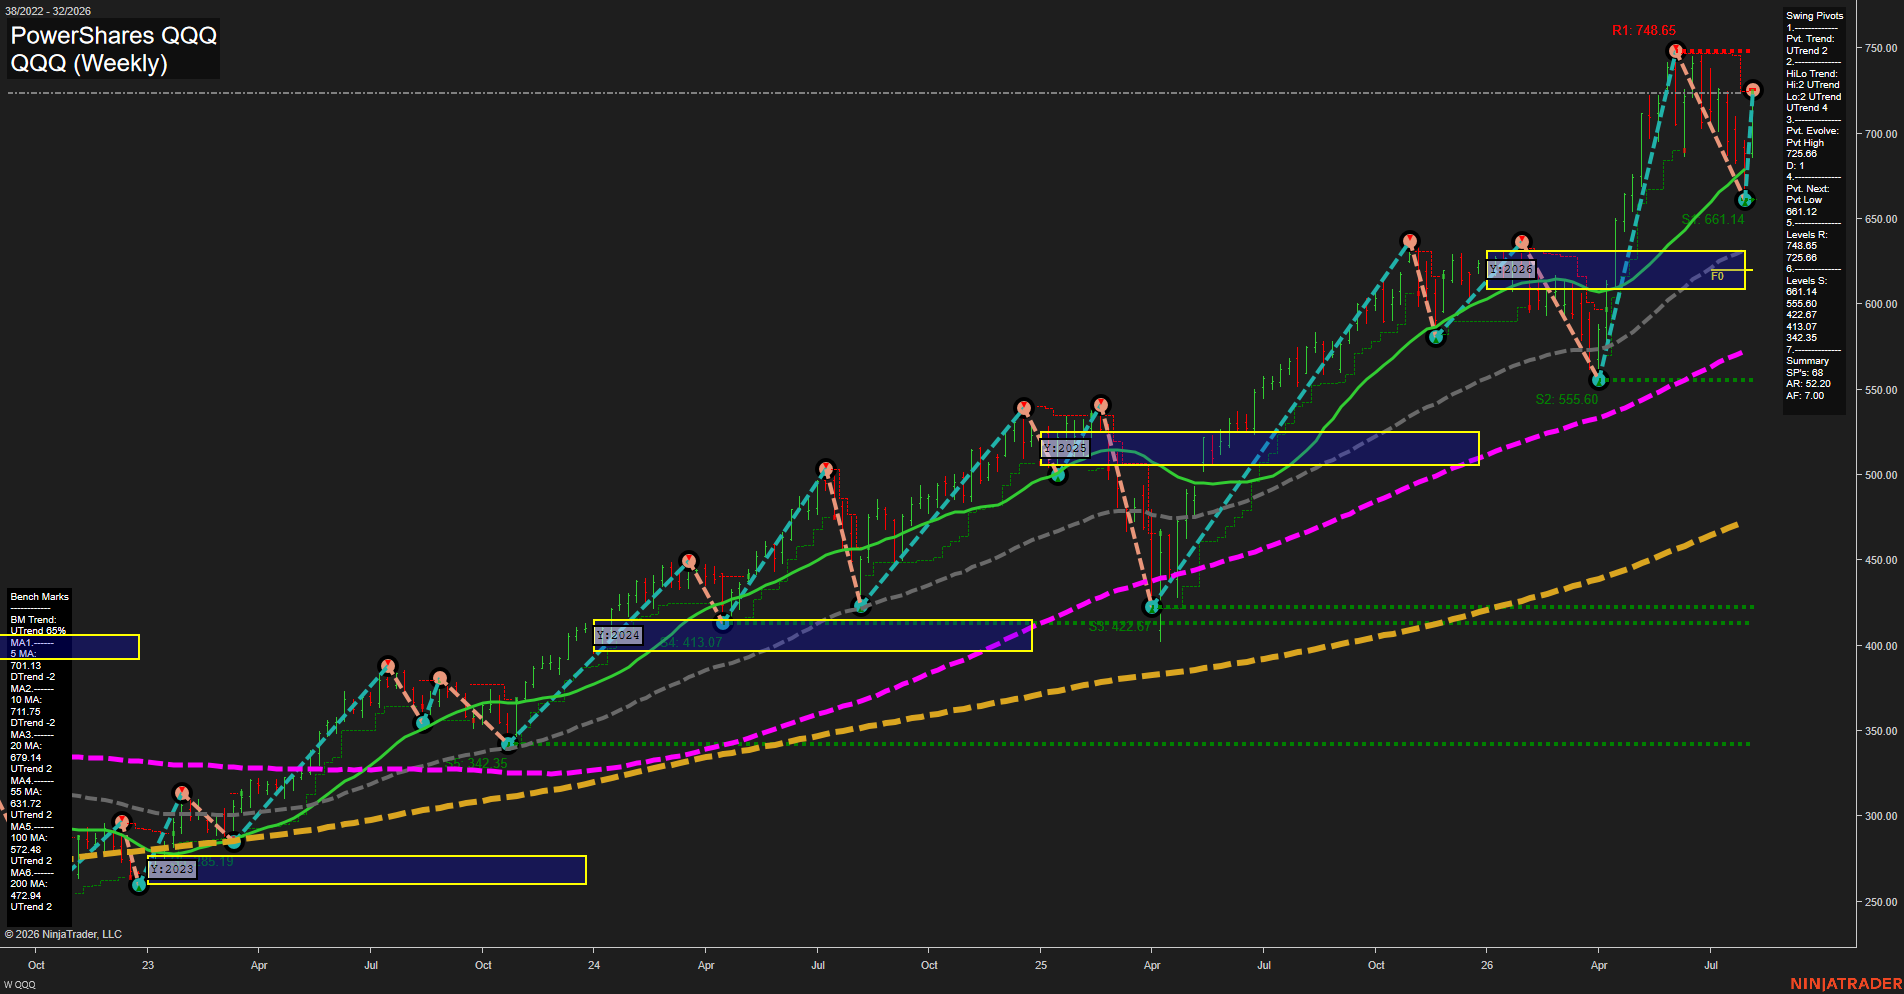
QQQ PowerShares QQQ Weekly Chart Analysis: 2026-Aug-05 07:07 CT
Price Action
- Last: 725.68,
- Bars: Large,
- Mom: fast.
WSFG Weekly
- Short-Term
- WSFG Current: NA%
- F0%/NTZ' Bias: Price Bullish,
- WSFG Trend: Bullish.
MSFG Month Aug
- Intermediate-Term
- MSFG Current: NA%
- F0%/NTZ' Bias: Price Bullish,
- MSFG Trend: Bullish.
YSFG Year 2026
- Long-Term
- YSFG Current: NA%
- F0%/NTZ' Bias: Price Bullish,
- YSFG Trend: Bullish.
Swing Pivots
- (Short-Term) 1. Pvt. Trend: UTrend,
- (Intermediate-Term) 2. HiLo Trend: UTrend,
- 3. Pvt. Evolve: Pvt high 725.68,
- 4. Pvt. Next: Pvt low 681.12,
- 5. Levels R: 748.65, 725.68,
- 6. Levels S: 681.14, 555.60, 522.67, 413.07, 342.35.
Weekly Benchmarks
- (Short-Term) 5 Day: 701.13 Up Trend,
- (Short-Term) 10 Day: 711.75 Down Trend,
- (Intermediate-Term) 20 Day: 679.14 Up Trend,
- (Intermediate-Term) 55 Day: 631.72 Up Trend,
- (Long-Term) 100 Day: 572.48 Up Trend,
- (Long-Term) 200 Day: 472.02 Up Trend.
Overall Rating
- Short-Term: Bullish,
- Intermediate-Term: Bullish,
- Long-Term: Bullish.
Key Insights Summary
QQQ reflects a strong Nasdaq futures-style risk-on structure: price has rebounded sharply from the 681.14 swing-support area and is again testing the 725.68 pivot-high region. The broader sequence remains higher highs and higher lows, with price materially above the rising 20, 55, 100, and 200-period benchmarks. The 10-period benchmark remains in a down trend, indicating the recent pullback has not been fully repaired at the shortest benchmark horizon. Resistance is concentrated at 725.68 and the 748.65 prior peak, while 681.14 is the key near-term structural support defining the current upside pivot framework.
Chart Analysis ATS AI Generated: 2026-08-05 07:08 for Informational use only, not trading advice. Terms and Risk Disclosure Copyright © 2026. Algo Trading Systems LLC.