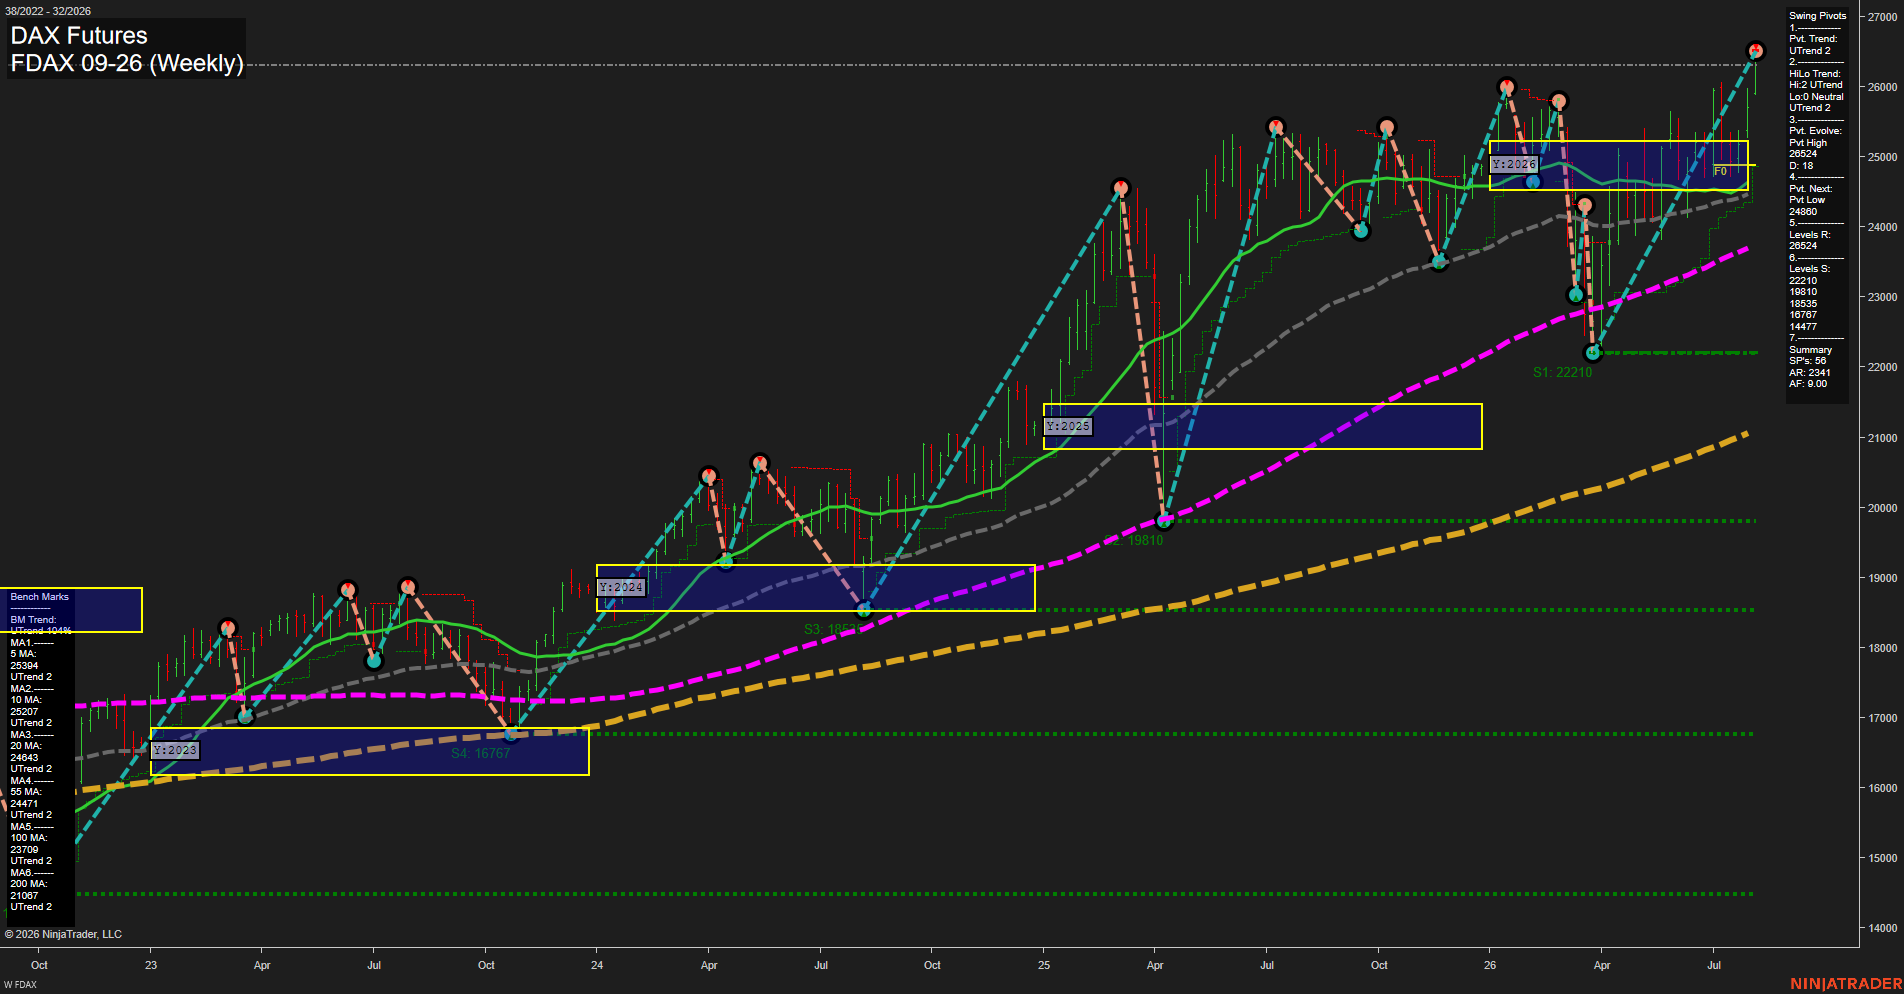
FDAX DAX Futures Weekly Chart Analysis: 2026-Aug-05 07:04 CT
Price Action
- Last: 26524,
- Bars: Large,
- Mom: fast.
WSFG Weekly
- Short-Term
- WSFG Current: 58%
- F0%/NTZ' Bias: Price Above,
- WSFG Trend: Up.
MSFG Month Aug
- Intermediate-Term
- MSFG Current: 27%
- F0%/NTZ' Bias: Price Above,
- MSFG Trend: Up.
YSFG Year 2026
- Long-Term
- YSFG Current: 42%
- F0%/NTZ' Bias: Price Above,
- YSFG Trend: Up.
Swing Pivots
- (Short-Term) 1. Pvt. Trend: UTrend,
- (Intermediate-Term) 2. HiLo Trend: UTrend,
- 3. Pvt. Evolve: Pvt high 26524,
- 4. Pvt. Next: Pvt low 24880,
- 5. Levels R: 26524,
- 6. Levels S: 22210, 19810, 18535, 17678, 14477.
Weekly Benchmarks
- (Short-Term) 5 Day: 25399 Up Trend,
- (Short-Term) 10 Day: 25207 Up Trend,
- (Intermediate-Term) 20 Day: 24643 Up Trend,
- (Intermediate-Term) 55 Day: 24471 Up Trend,
- (Long-Term) 100 Day: 23709 Up Trend,
- (Long-Term) 200 Day: 21087 Up Trend.
Recent Trade Signals
- 04 Aug 2026: Long FDAX 09-26 @ 26213 Signals.USAR-MSFG
- 28 Jul 2026: Long FDAX 09-26 @ 25548 Signals.USAR-WSFG
Overall Rating
- Short-Term: Bullish,
- Intermediate-Term: Bullish,
- Long-Term: Bullish.
Key Insights Summary
FDAX is in a broad multi-timeframe advance, with price above every benchmark and the moving-average structure rising from the 5-day through 200-day measures. Weekly and monthly grid conditions remain above their F0%/NTZ reference areas, while the pivot structure retains higher highs and higher lows. The recent move has accelerated into the 26524 pivot-high resistance area, producing fast momentum and larger weekly ranges after the recovery from the 24880 reversal threshold. The dominant structure remains trend continuation, although the proximity to the active pivot high makes this an extended, high-momentum phase rather than a base-building consolidation.
Chart Analysis ATS AI Generated: 2026-08-05 07:05 for Informational use only, not trading advice. Terms and Risk Disclosure Copyright © 2026. Algo Trading Systems LLC.