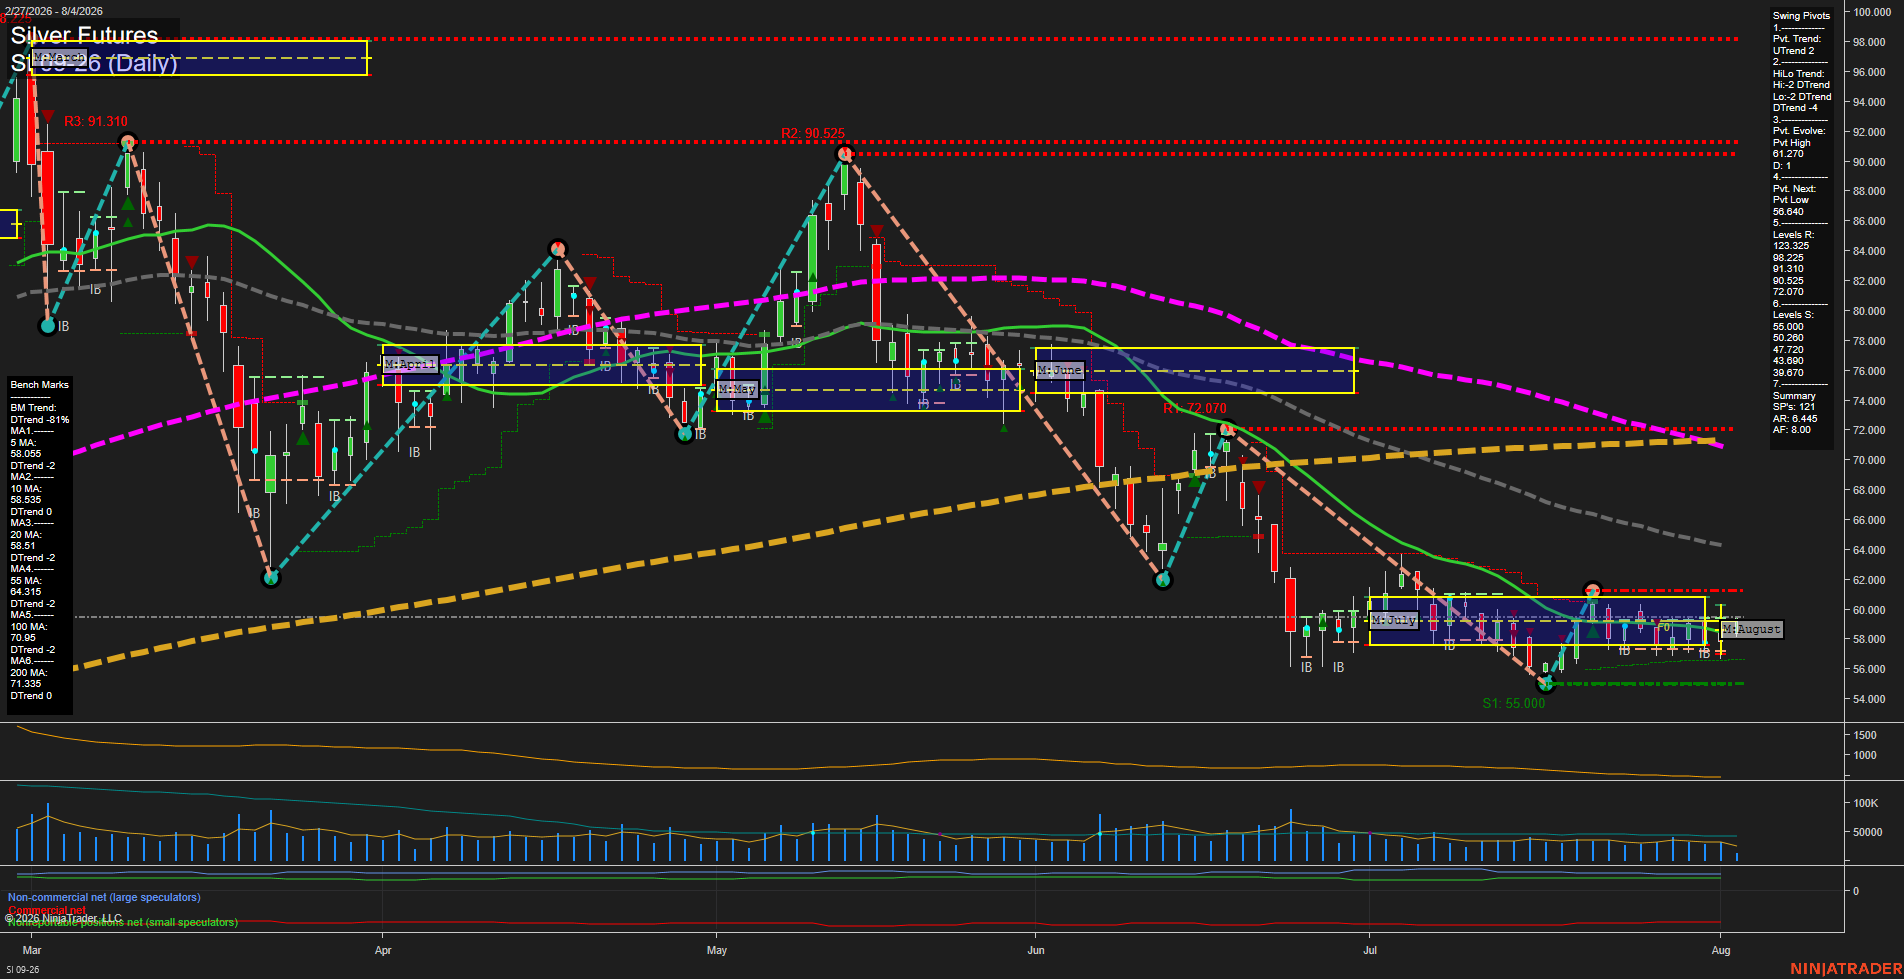
SI Silver Futures Daily Chart Analysis: 2026-Aug-04 07:08 CT
Price Action
- Last: 58.845,
- Bars: Small,
- Mom: Slow.
WSFG Weekly
- Short-Term
- WSFG Current: 20%
- F0%/NTZ' Bias: Price Above,
- WSFG Trend: Up.
MSFG Month Aug
- Intermediate-Term
- MSFG Current: 7%
- F0%/NTZ' Bias: Price Above,
- MSFG Trend: Up.
YSFG Year 2026
- Long-Term
- YSFG Current: -177%
- F0%/NTZ' Bias: Price Below,
- YSFG Trend: Down.
Swing Pivots
- (Short-Term) 1. Pvt. Trend: UTrend,
- (Intermediate-Term) 2. HiLo Trend: DTrend,
- 3. Pvt. Evolve: Pvt high 61.700,
- 4. Pvt. Next: Pvt low 56.640,
- 5. Levels R: 123.250, 98.225, 91.310, 90.525, 72.070,
- 6. Levels S: 55.000, 50.200, 47.620, 43.690, 39.670.
Daily Benchmarks
- (Short-Term) 5 Day: 58.055 Down Trend,
- (Short-Term) 10 Day: 58.535 Down Trend,
- (Intermediate-Term) 20 Day: 58.500 Down Trend,
- (Intermediate-Term) 55 Day: 64.315 Down Trend,
- (Long-Term) 100 Day: 79.860 Down Trend,
- (Long-Term) 200 Day: 71.335 Down Trend.
Additional Metrics
- ATR: 6.445,
- VOLMA: 55116.
Recent Trade Signals
- 04 Aug 2026: Long SI 09-26 @ 59.19 Signals.USAR-WSFG
- 30 Jul 2026: Long SI 09-26 @ 58.845 Signals.USAR.TR120
Overall Rating
- Short-Term: Bullish,
- Intermediate-Term: Bearish,
- Long-Term: Bearish.
Key Insights Summary
Silver is consolidating in a narrow, low-momentum range around 58.845 after the June decline and July base formation. The weekly and monthly fib grids remain positive and the active short-term pivot is an UTrend, but the intermediate pivot structure remains a DTrend and price is below the declining 55, 100, and 200 day benchmarks. The 61.700 evolving pivot high defines the nearby recovery ceiling, while 56.640 and 55.000 mark the principal lower-range pivot supports; the broader chart remains a counter-trend bounce within a longer-term bearish structure.
Chart Analysis ATS AI Generated: 2026-08-04 07:08 for Informational use only, not trading advice. Terms and Risk Disclosure Copyright © 2026. Algo Trading Systems LLC.