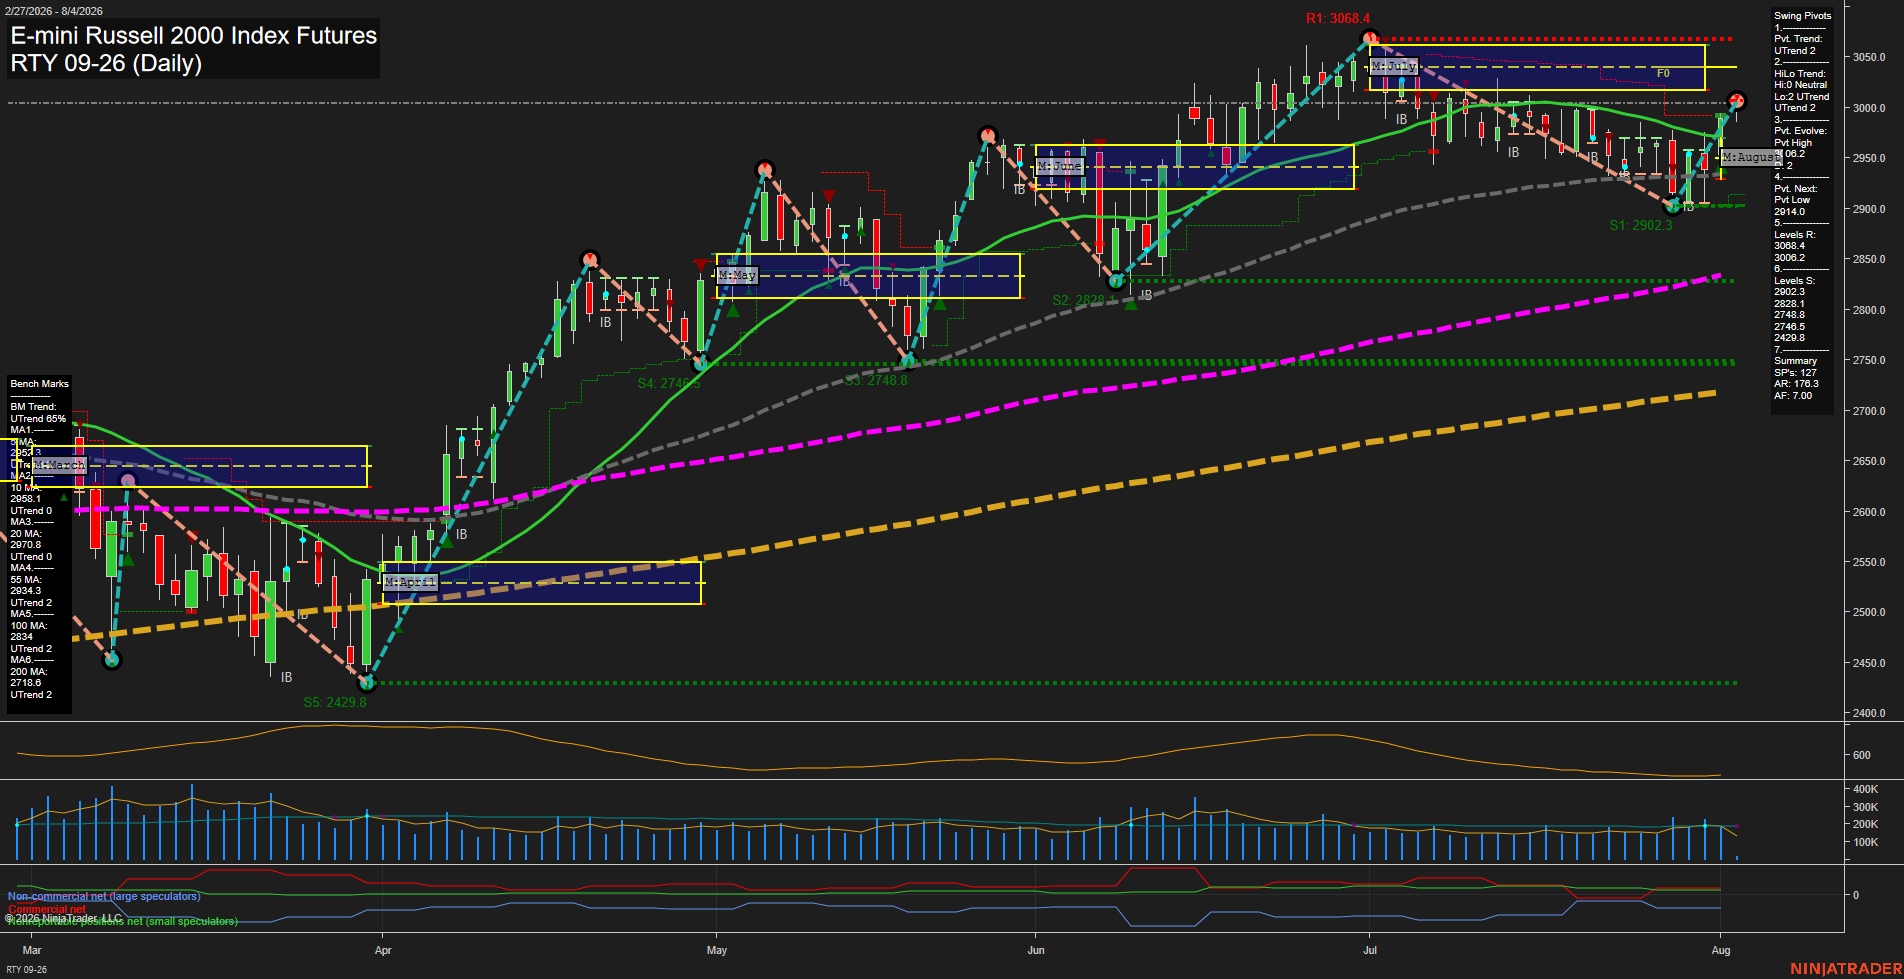
RTY E-mini Russell 2000 Index Futures Daily Chart Analysis: 2026-Aug-04 07:08 CT
Price Action
- Last: 3002.2,
- Bars: Medium,
- Mom: Fast.
WSFG Weekly
- Short-Term
- WSFG Current: 67%
- F0%/NTZ' Bias: Price Above,
- WSFG Trend: Up.
MSFG Month Aug
- Intermediate-Term
- MSFG Current: 24%
- F0%/NTZ' Bias: Price Above,
- MSFG Trend: Up.
YSFG Year 2026
- Long-Term
- YSFG Current: 73%
- F0%/NTZ' Bias: Price Above,
- YSFG Trend: Up.
Swing Pivots
- (Short-Term) 1. Pvt. Trend: UTrend,
- (Intermediate-Term) 2. HiLo Trend: UTrend,
- 3. Pvt. Evolve: Pvt high 3002.2,
- 4. Pvt. Next: Pvt low 2914.0,
- 5. Levels R: 3068.4, 3002.2,
- 6. Levels S: 2902.3, 2828.1, 2748.8, 2746.5, 2429.8.
Daily Benchmarks
- (Short-Term) 5 Day: 2952.3 Up Trend,
- (Short-Term) 10 Day: 2958.1 Up Trend,
- (Intermediate-Term) 20 Day: 2970.8 Up Trend,
- (Intermediate-Term) 55 Day: 2934.3 Up Trend,
- (Long-Term) 100 Day: 2834.0 Up Trend,
- (Long-Term) 200 Day: 2718.6 Up Trend.
Additional Metrics
Recent Trade Signals
- 04 Aug 2026: Long RTY 09-26 @ 2992.9 Signals.USAR-MSFG
- 03 Aug 2026: Long RTY 09-26 @ 2985.9 Signals.USAR.TR120
- 03 Aug 2026: Long RTY 09-26 @ 2960 Signals.USAR-WSFG
Overall Rating
- Short-Term: Bullish,
- Intermediate-Term: Bullish,
- Long-Term: Bullish.
Key Insights Summary
RTY has produced a fast rebound from the 2902.3 swing-support area and is pressing the 3002.2 pivot-high area. The short-term pivot structure is upward, while the higher-low intermediate structure and all six rising benchmark averages maintain a broad bullish alignment. Price is trading beneath major resistance at 3068.4 after recovering above the 20-day and 55-day benchmarks, characterizing the recent action as a strong continuation bounce within the larger advance. The 2914.0 next-pivot level and 2902.3 support define the nearby pullback structure, while 3068.4 remains the prominent prior high and upper resistance reference.
Chart Analysis ATS AI Generated: 2026-08-04 07:08 for Informational use only, not trading advice. Terms and Risk Disclosure Copyright © 2026. Algo Trading Systems LLC.