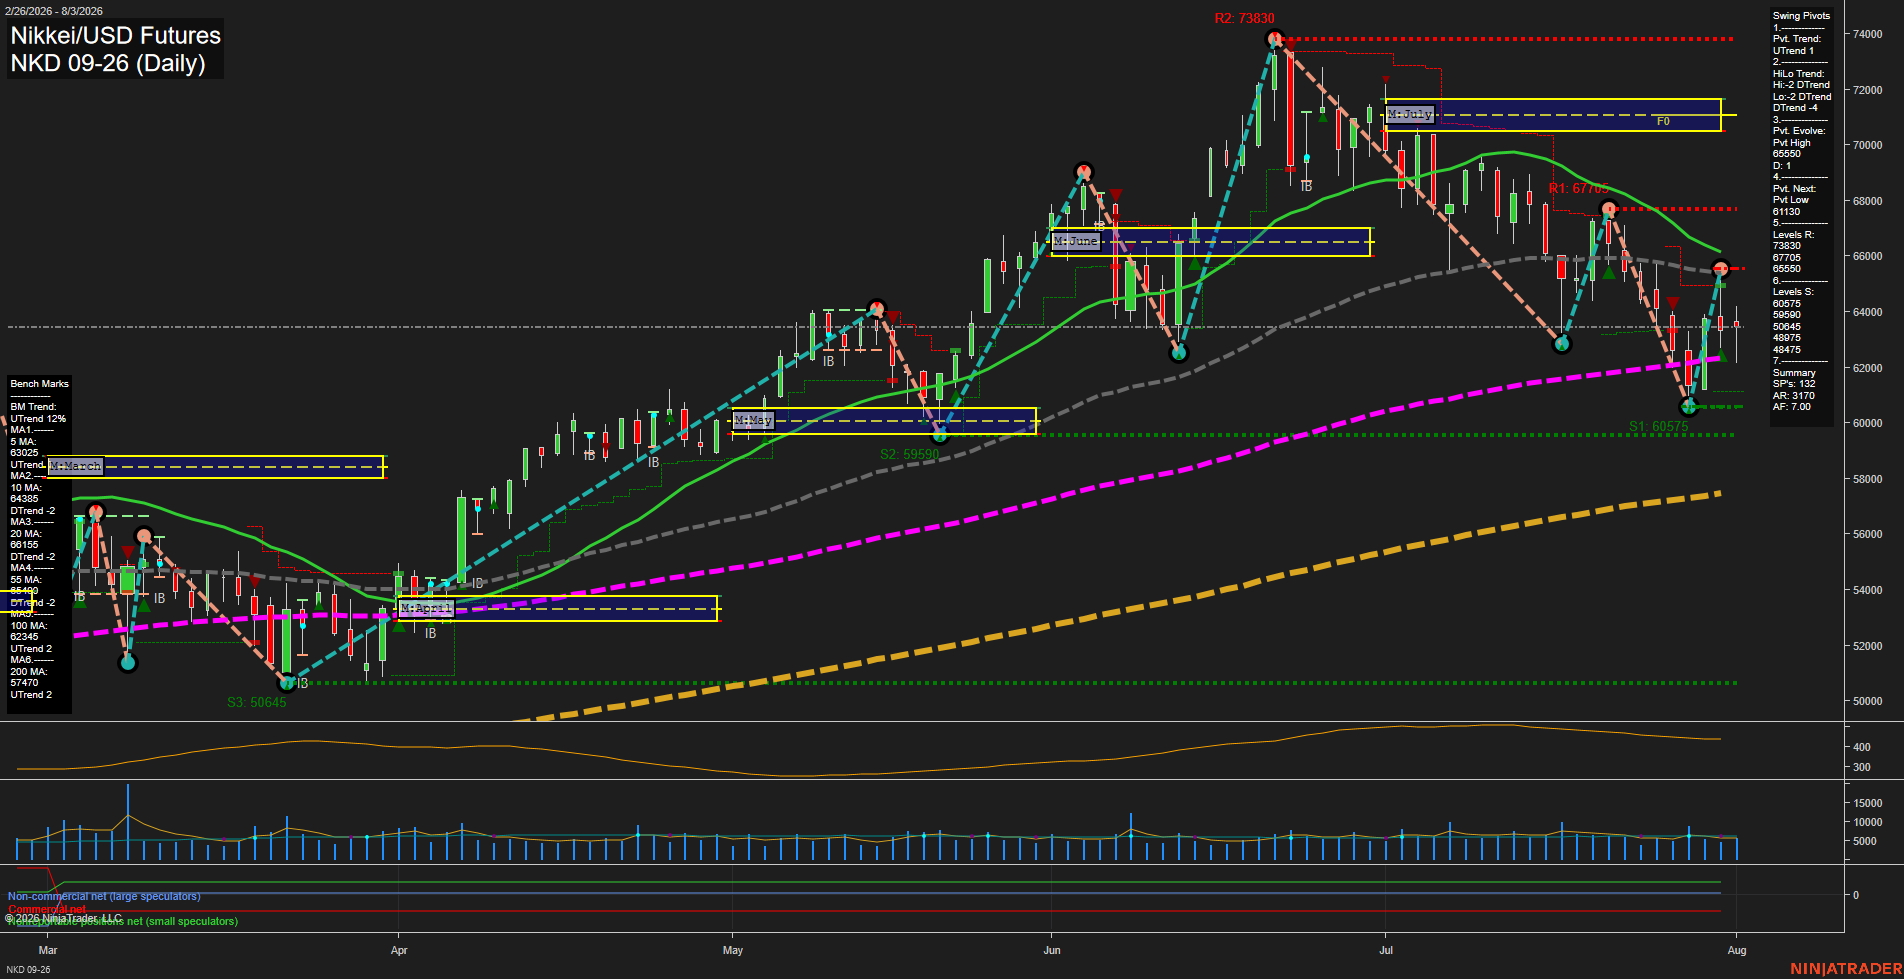
NKD Nikkei/USD Futures Daily Chart Analysis: 2026-Aug-04 07:06 CT
Price Action
- Last: 63025,
- Bars: Small,
- Mom: average.
WSFG Weekly
- Short-Term
- WSFG Current: 17%
- F0%/NTZ' Bias: Price Above,
- WSFG Trend: Up.
MSFG Month Aug
- Intermediate-Term
- MSFG Current: 9%
- F0%/NTZ' Bias: Price Above,
- MSFG Trend: Up.
YSFG Year 2026
- Long-Term
- YSFG Current: 162%
- F0%/NTZ' Bias: Price Above,
- YSFG Trend: Up.
Swing Pivots
- (Short-Term) 1. Pvt. Trend: UTrend,
- (Intermediate-Term) 2. HiLo Trend: DTrend,
- 3. Pvt. Evolve: Pvt high 65550,
- 4. Pvt. Next: Pvt low 61330,
- 5. Levels R: 73830, 67705, 65550,
- 6. Levels S: 60575, 59590, 50645, 48975, 48440.
Daily Benchmarks
- (Short-Term) 5 Day: 63025 Up Trend,
- (Short-Term) 10 Day: 64385 Down Trend,
- (Intermediate-Term) 20 Day: 66155 Down Trend,
- (Intermediate-Term) 55 Day: 65440 Down Trend,
- (Long-Term) 100 Day: 62240 Up Trend,
- (Long-Term) 200 Day: 57470 Up Trend.
Additional Metrics
Recent Trade Signals
- 04 Aug 2026: Long NKD 09-26 @ 64340 Signals.USAR-WSFG
Overall Rating
- Short-Term: Neutral,
- Intermediate-Term: Bearish,
- Long-Term: Bullish.
Key Insights Summary
NKD is consolidating after a sharp July decline and rebound from the 60575 pivot support area. The short-term pivot structure has turned higher, but price remains below the declining 10-, 20-, and 55-day benchmarks, leaving the intermediate swing structure in a corrective lower-high phase. The longer-term structure remains constructive above the rising 100- and 200-day averages. Resistance is layered at 65550, 67705, and 73830, while 61330 and 60575 define the nearest downside pivot zone. Volatility remains elevated, consistent with broad daily ranges and choppy countertrend movement.
Chart Analysis ATS AI Generated: 2026-08-04 07:06 for Informational use only, not trading advice. Terms and Risk Disclosure Copyright © 2026. Algo Trading Systems LLC.