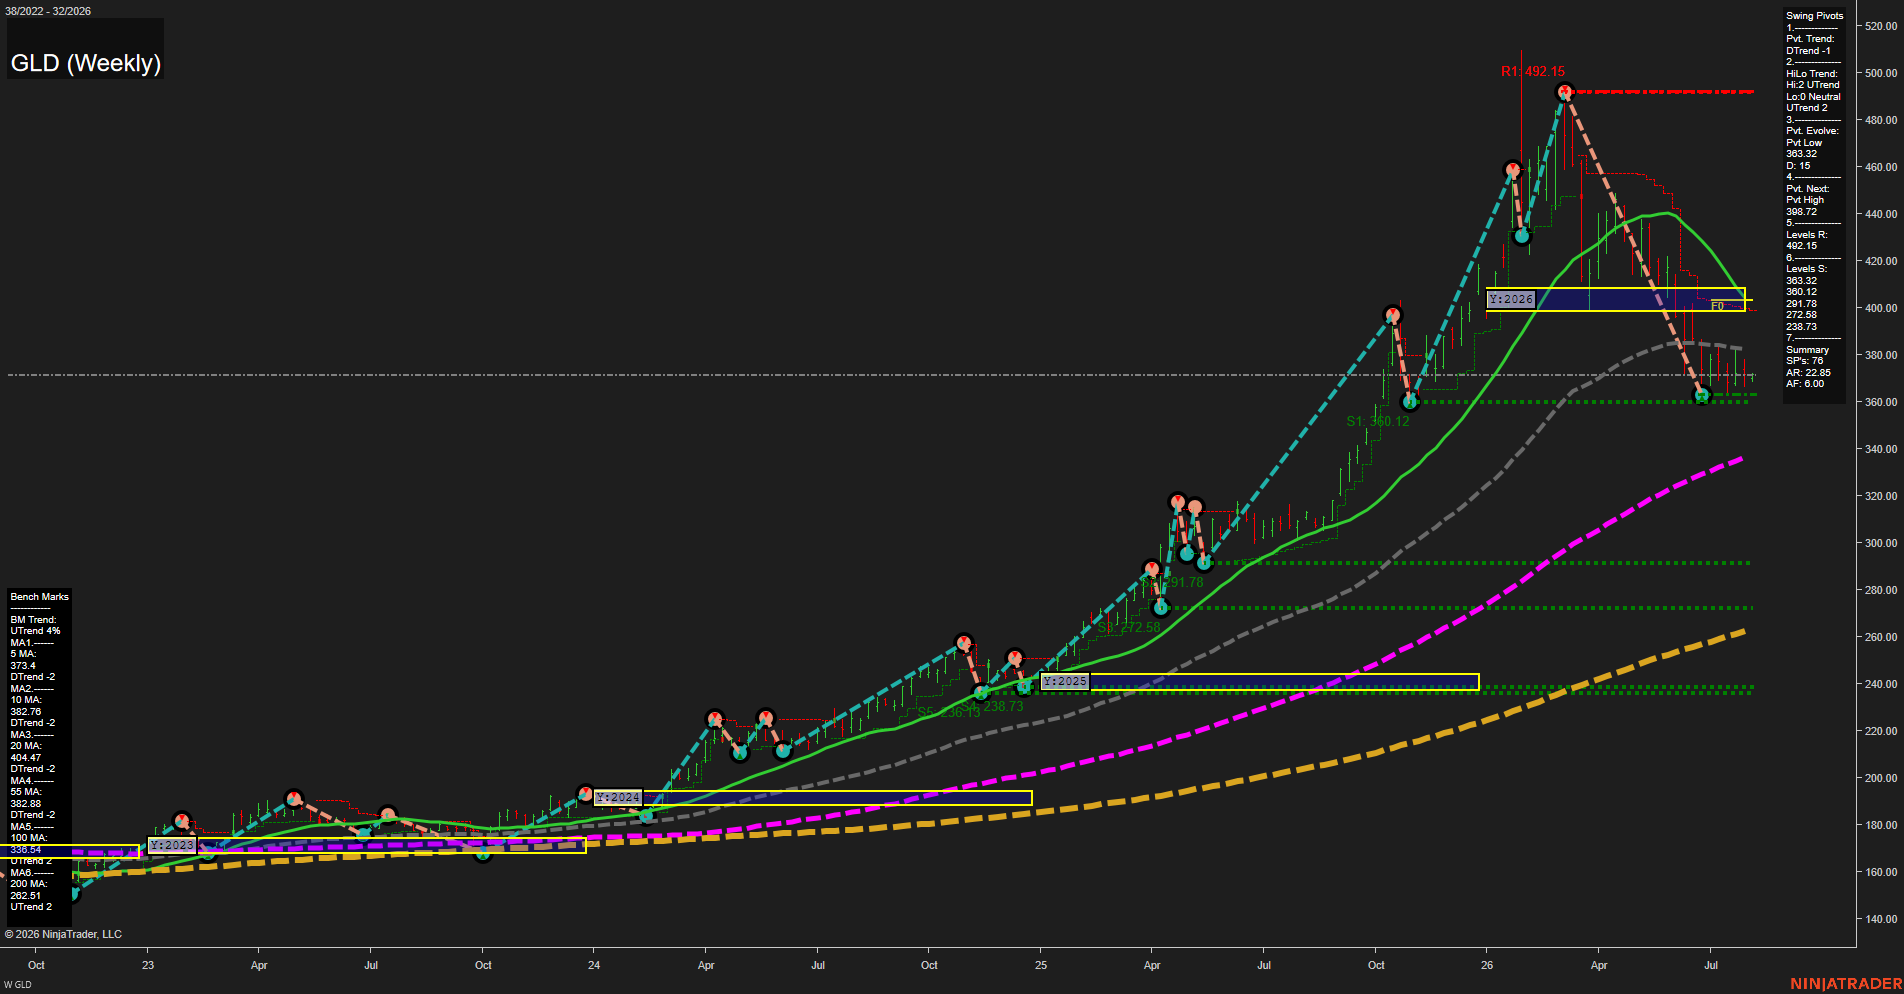
GLD SPDR Gold Shares Weekly Chart Analysis: 2026-Aug-04 07:06 CT
Price Action
- Last: 373.49,
- Bars: Small,
- Mom: Slow.
WSFG Weekly
- Short-Term
- WSFG Current: NA%
- F0%/NTZ' Bias: Price Neutral,
- WSFG Trend: Neutral.
MSFG Month Aug
- Intermediate-Term
- MSFG Current: NA%
- F0%/NTZ' Bias: Price Neutral,
- MSFG Trend: Neutral.
YSFG Year 2026
- Long-Term
- YSFG Current: NA%
- F0%/NTZ' Bias: Price Below F0%,
- YSFG Trend: Bearish.
Swing Pivots
- (Short-Term) 1. Pvt. Trend: DTrend,
- (Intermediate-Term) 2. HiLo Trend: UTrend,
- 3. Pvt. Evolve: Pvt low 363.32,
- 4. Pvt. Next: Pvt high 398.72,
- 5. Levels R: 492.15,
- 6. Levels S: 363.39, 360.12, 291.78, 272.58, 238.73.
Weekly Benchmarks
- (Short-Term) 5 Day: 373.40 Down Trend,
- (Short-Term) 10 Day: 382.78 Down Trend,
- (Intermediate-Term) 20 Day: 404.47 Down Trend,
- (Intermediate-Term) 55 Day: 382.88 Down Trend,
- (Long-Term) 100 Day: 336.54 Up Trend,
- (Long-Term) 200 Day: 262.51 Up Trend.
Overall Rating
- Short-Term: Bearish,
- Intermediate-Term: Bearish,
- Long-Term: Bullish.
Key Insights Summary
GLD reflects a futures-style corrective swing phase within a still-constructive major uptrend. Price is consolidating just above the 363.39 to 360.12 support band after a sharp decline from the 492.15 pivot high, while the short-term pivot structure remains in DTrend and price is below the declining 10-, 20-, and 55-period benchmarks. The intermediate HiLo structure remains UTrend because the broader sequence retains elevated swing lows, but the weekly recovery has not yet reclaimed the 382.88 to 404.47 benchmark zone or the 398.72 next-pivot threshold. The longer-term trend remains supported by rising 100- and 200-period averages well below current price, framing the present action as a substantial retracement and sideways digestion rather than a confirmed major-trend reversal.
Chart Analysis ATS AI Generated: 2026-08-04 07:06 for Informational use only, not trading advice. Terms and Risk Disclosure Copyright © 2026. Algo Trading Systems LLC.