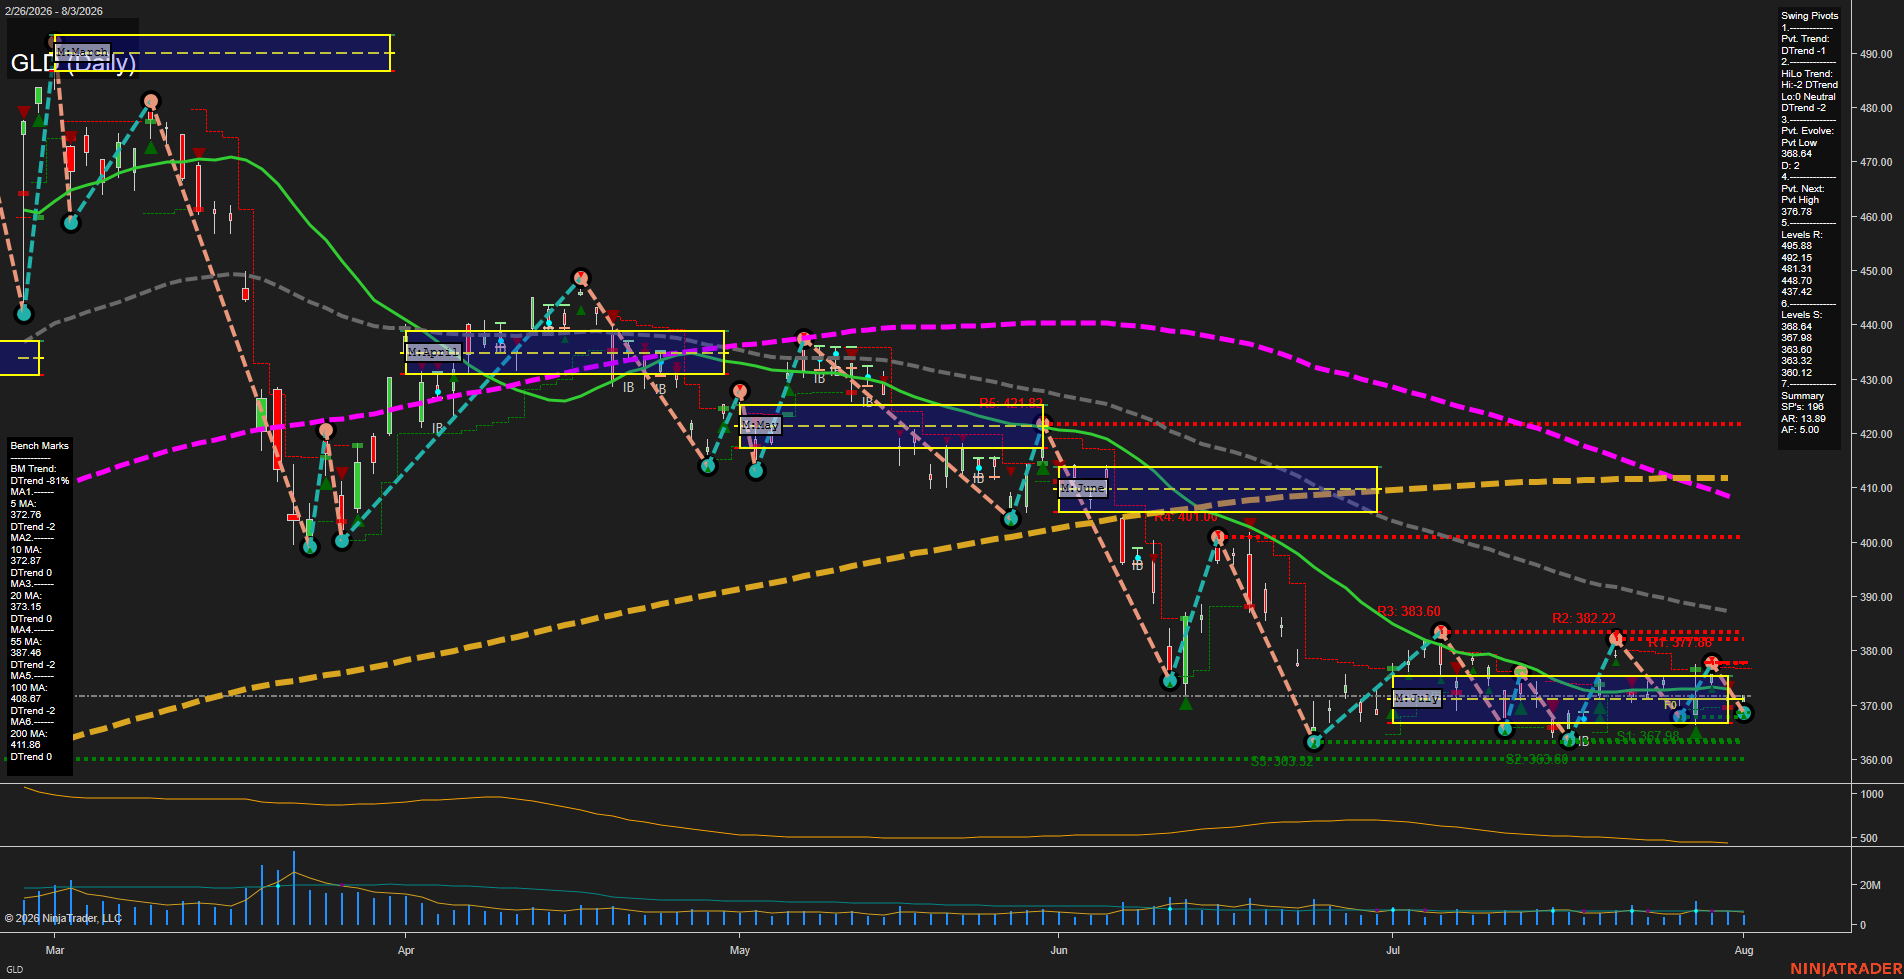
GLD SPDR Gold Shares Daily Chart Analysis: 2026-Aug-04 07:05 CT
Price Action
- Last: 368.64,
- Bars: Small,
- Mom: Slow.
WSFG Weekly
- Short-Term
- WSFG Current: NA%
- F0%/NTZ' Bias: Price Neutral,
- WSFG Trend: Neutral.
MSFG Month Aug
- Intermediate-Term
- MSFG Current: NA%
- F0%/NTZ' Bias: Price Bearish,
- MSFG Trend: Bearish.
YSFG Year 2026
- Long-Term
- YSFG Current: NA%
- F0%/NTZ' Bias: Price Neutral,
- YSFG Trend: Neutral.
Swing Pivots
- (Short-Term) 1. Pvt. Trend: DTrend,
- (Intermediate-Term) 2. HiLo Trend: DTrend,
- 3. Pvt. Evolve: Pvt low 368.64,
- 4. Pvt. Next: Pvt high 376.78,
- 5. Levels R: 495.88, 492.15, 481.31, 448.70, 437.42,
- 6. Levels S: 368.64, 367.98, 366.60, 363.32, 360.12.
Daily Benchmarks
- (Short-Term) 5 Day: 372.76 Down Trend,
- (Short-Term) 10 Day: 372.87 Down Trend,
- (Intermediate-Term) 20 Day: 373.42 Down Trend,
- (Intermediate-Term) 55 Day: 387.48 Down Trend,
- (Long-Term) 100 Day: 408.67 Down Trend,
- (Long-Term) 200 Day: 411.86 Down Trend.
Additional Metrics
Overall Rating
- Short-Term: Bearish,
- Intermediate-Term: Bearish,
- Long-Term: Bearish.
Key Insights Summary
GLD remains in a broad futures-style bear structure, with both pivot trend measures in DTrend and price trading beneath all six daily benchmarks. The latest price action is compressed near the 368.64 pivot low and clustered support from 367.98 through 360.12, reflecting slow momentum and consolidation following the June-July decline. The 376.78 pivot-high reversal level is the immediate swing reference, while the 373 area contains the declining short-term benchmark cluster. Higher resistance is concentrated near 382-387, followed by the much more distant 408-412 long-term moving-average zone. ATR has contracted to 13.89, consistent with reduced daily range expansion as price bases near support.
Chart Analysis ATS AI Generated: 2026-08-04 07:06 for Informational use only, not trading advice. Terms and Risk Disclosure Copyright © 2026. Algo Trading Systems LLC.