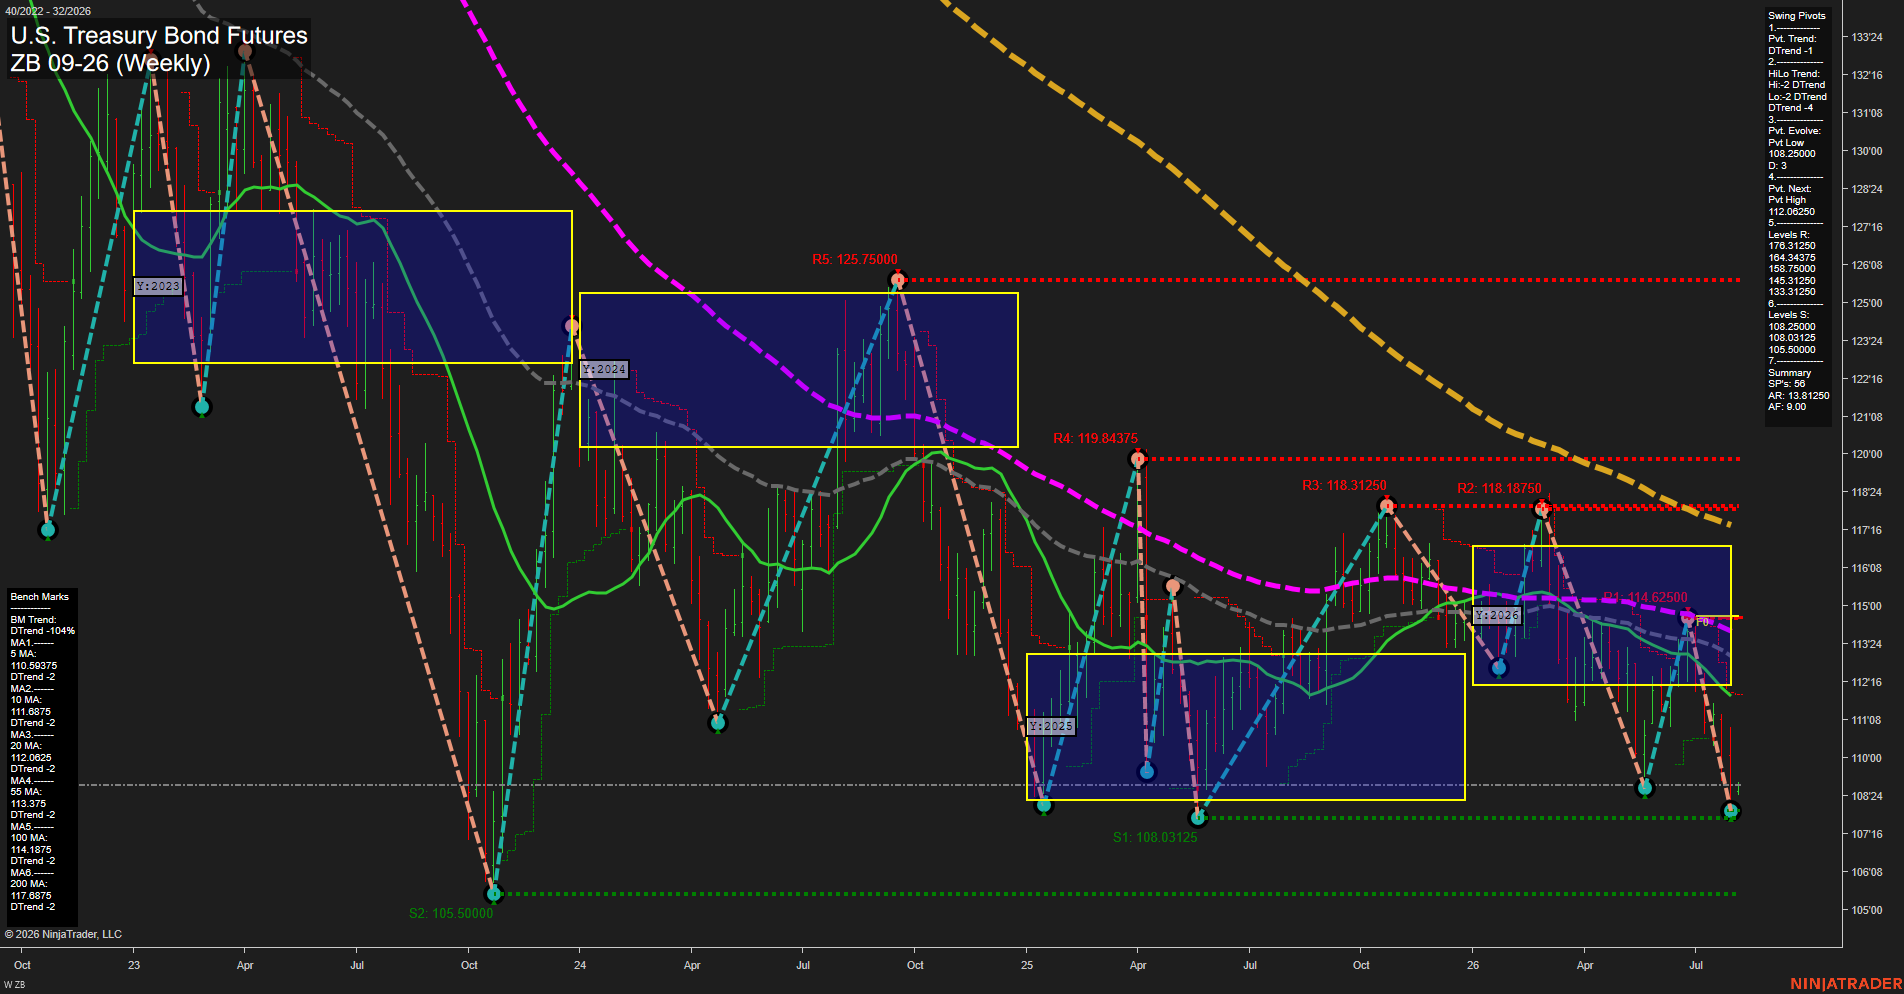
ZB U.S. Treasury Bond Futures Weekly Chart Analysis: 2026-Aug-03 07:11 CT
Price Action
- Last: 108.5625,
- Bars: Small,
- Mom: Slow.
WSFG Weekly
- Short-Term
- WSFG Current: NA%
- F0%/NTZ' Bias: Price Bearish,
- WSFG Trend: Down.
MSFG Month Aug
- Intermediate-Term
- MSFG Current: NA%
- F0%/NTZ' Bias: Price Bearish,
- MSFG Trend: Down.
YSFG Year 2026
- Long-Term
- YSFG Current: NA%
- F0%/NTZ' Bias: Price Bearish,
- YSFG Trend: Down.
Swing Pivots
- (Short-Term) 1. Pvt. Trend: DTrend,
- (Intermediate-Term) 2. HiLo Trend: DTrend,
- 3. Pvt. Evolve: Pvt low 108.5000,
- 4. Pvt. Next: Pvt high 112.0625,
- 5. Levels R: 176.3125, 164.34375, 158.7500, 153.3125, 133.3125,
- 6. Levels S: 108.5000, 108.03125, 105.5000.
Weekly Benchmarks
- (Short-Term) 5 Day: 110.59375 Down Trend,
- (Short-Term) 10 Day: 111.6875 Down Trend,
- (Intermediate-Term) 20 Day: 112.0625 Down Trend,
- (Intermediate-Term) 55 Day: 113.375 Down Trend,
- (Long-Term) 100 Day: 114.1875 Down Trend,
- (Long-Term) 200 Day: 117.6875 Down Trend.
Overall Rating
- Short-Term: Bearish,
- Intermediate-Term: Bearish,
- Long-Term: Bearish.
Key Insights Summary
The weekly structure remains broadly bearish: price is holding near the 108.5000 pivot-low area and remains below every benchmark average, all of which are declining. The sequence of lower pivot highs and lower pivot lows confirms the intermediate pivot downtrend. Momentum has slowed into support, producing small weekly bars and a consolidation-like response near 108.03125–108.5000, but there is not yet a confirmed pivot reversal. The 112.0625 next-pivot threshold is the nearby structural level separating the current low-base condition from a short-term recovery phase; overhead moving-average and Fib-grid resistance remains concentrated from roughly 110.59375 through 114.6250.
Chart Analysis ATS AI Generated: 2026-08-03 07:12 for Informational use only, not trading advice. Terms and Risk Disclosure Copyright © 2026. Algo Trading Systems LLC.