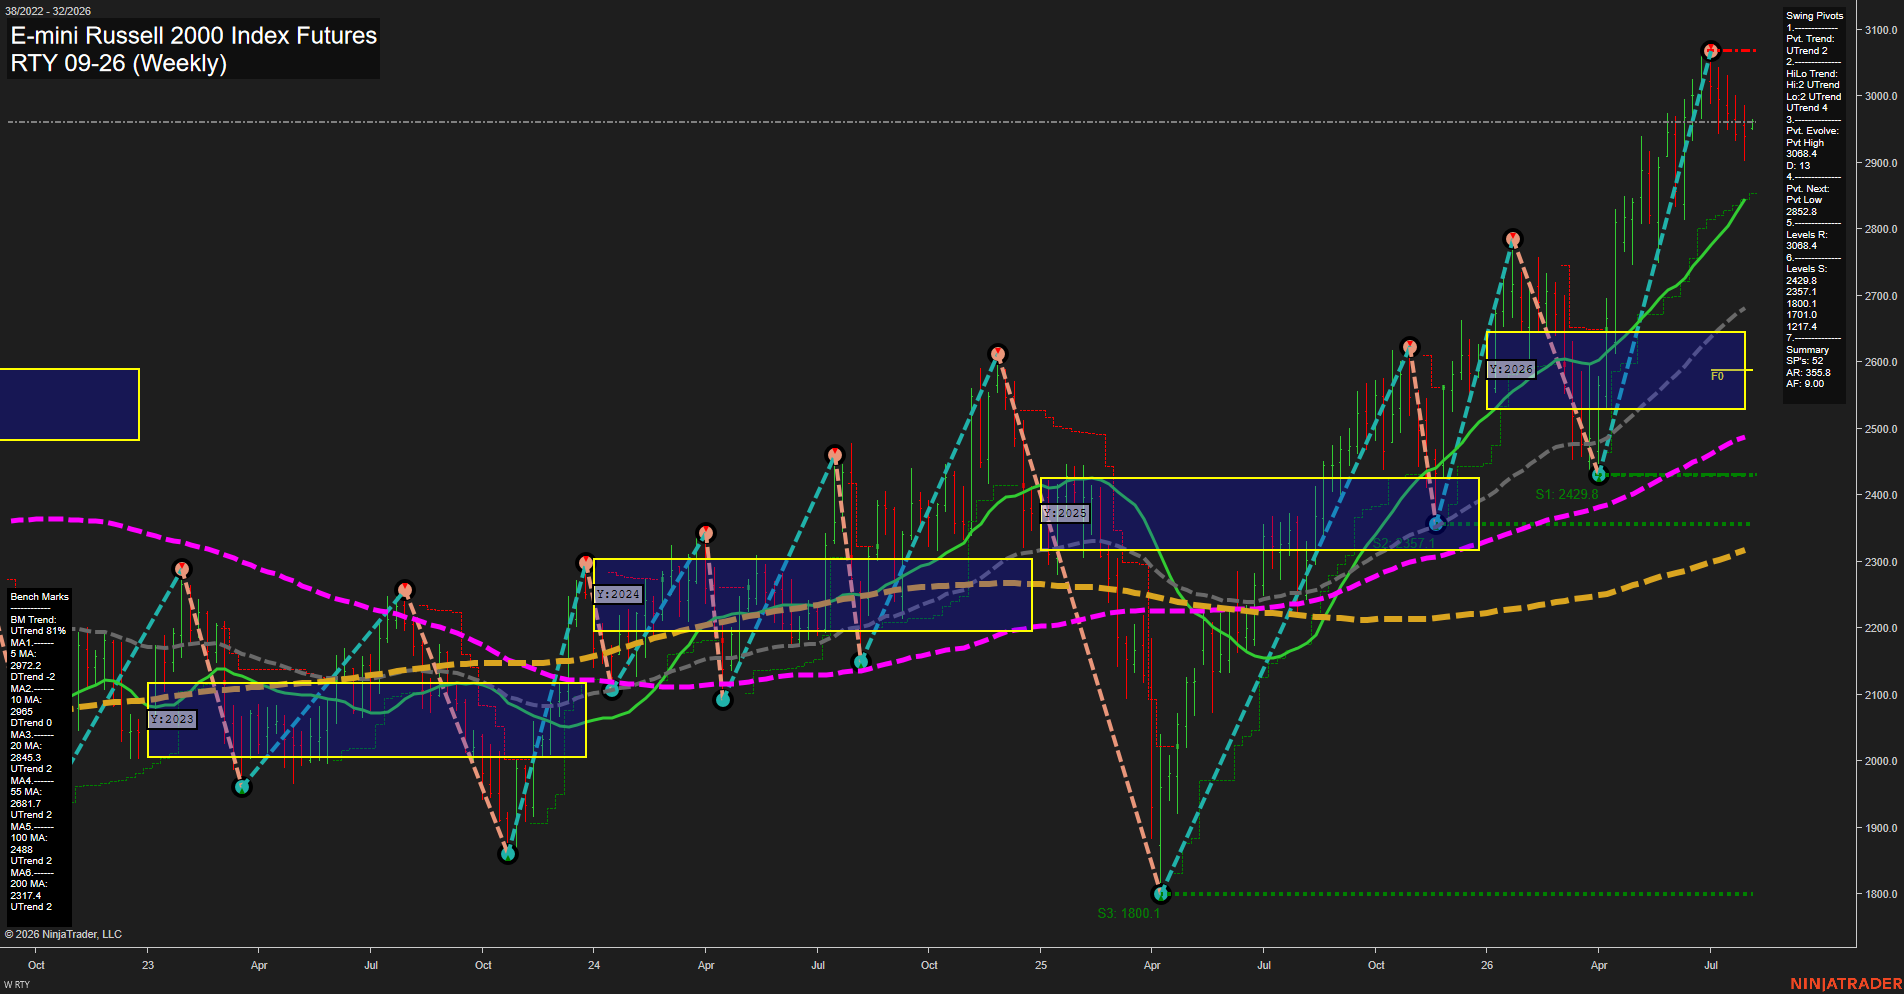
RTY E-mini Russell 2000 Index Futures Weekly Chart Analysis: 2026-Aug-03 07:08 CT
Price Action
- Last: 2960.0,
- Bars: Medium,
- Mom: Fast.
WSFG Weekly
- Short-Term
- WSFG Current: 10%
- F0%/NTZ' Bias: Price Above,
- WSFG Trend: Up.
MSFG Month Aug
- Intermediate-Term
- MSFG Current: 3%
- F0%/NTZ' Bias: Price Above,
- MSFG Trend: Up.
YSFG Year 2026
- Long-Term
- YSFG Current: 65%
- F0%/NTZ' Bias: Price Above,
- YSFG Trend: Up.
Swing Pivots
- (Short-Term) 1. Pvt. Trend: UTrend,
- (Intermediate-Term) 2. HiLo Trend: UTrend,
- 3. Pvt. Evolve: Pvt high 3068.4,
- 4. Pvt. Next: Pvt low 2852.8,
- 5. Levels R: 3068.4,
- 6. Levels S: 2429.8, 2357.1, 1800.1, 1701.0, 1217.4, 717.7.
Weekly Benchmarks
- (Short-Term) 5 Day: 2972.2 Down Trend,
- (Short-Term) 10 Day: 2965.0 Down Trend,
- (Intermediate-Term) 20 Day: 2845.3 Up Trend,
- (Intermediate-Term) 55 Day: 2681.7 Up Trend,
- (Long-Term) 100 Day: 2488.0 Up Trend,
- (Long-Term) 200 Day: 2317.4 Up Trend.
Recent Trade Signals
- 03 Aug 2026: Long RTY 09-26 @ 2960 Signals.USAR-WSFG
- 31 Jul 2026: Long RTY 09-26 @ 2959.9 Signals.USAR.TR120
Overall Rating
- Short-Term: Bullish,
- Intermediate-Term: Bullish,
- Long-Term: Bullish.
Key Insights Summary
RTY remains in a broad multi-timeframe advance, with price above the weekly, monthly, and yearly F0%/NTZ areas and above all major intermediate- and long-term benchmarks. The latest push to the 3068.4 pivot high was a fast upside extension, followed by medium-sized consolidation bars near 2960. Short-term moving-average slopes have softened beneath price, while the active pivot and HiLo structures remain UTrend. The 3068.4 pivot high is the defined upside swing reference, while 2852.8 marks the next short-term pivot reversal threshold. The larger pattern continues to show higher highs and higher lows from the April low, with the 20-week benchmark at 2845.3 aligning closely with the current swing-reversal area.
Chart Analysis ATS AI Generated: 2026-08-03 07:08 for Informational use only, not trading advice. Terms and Risk Disclosure Copyright © 2026. Algo Trading Systems LLC.