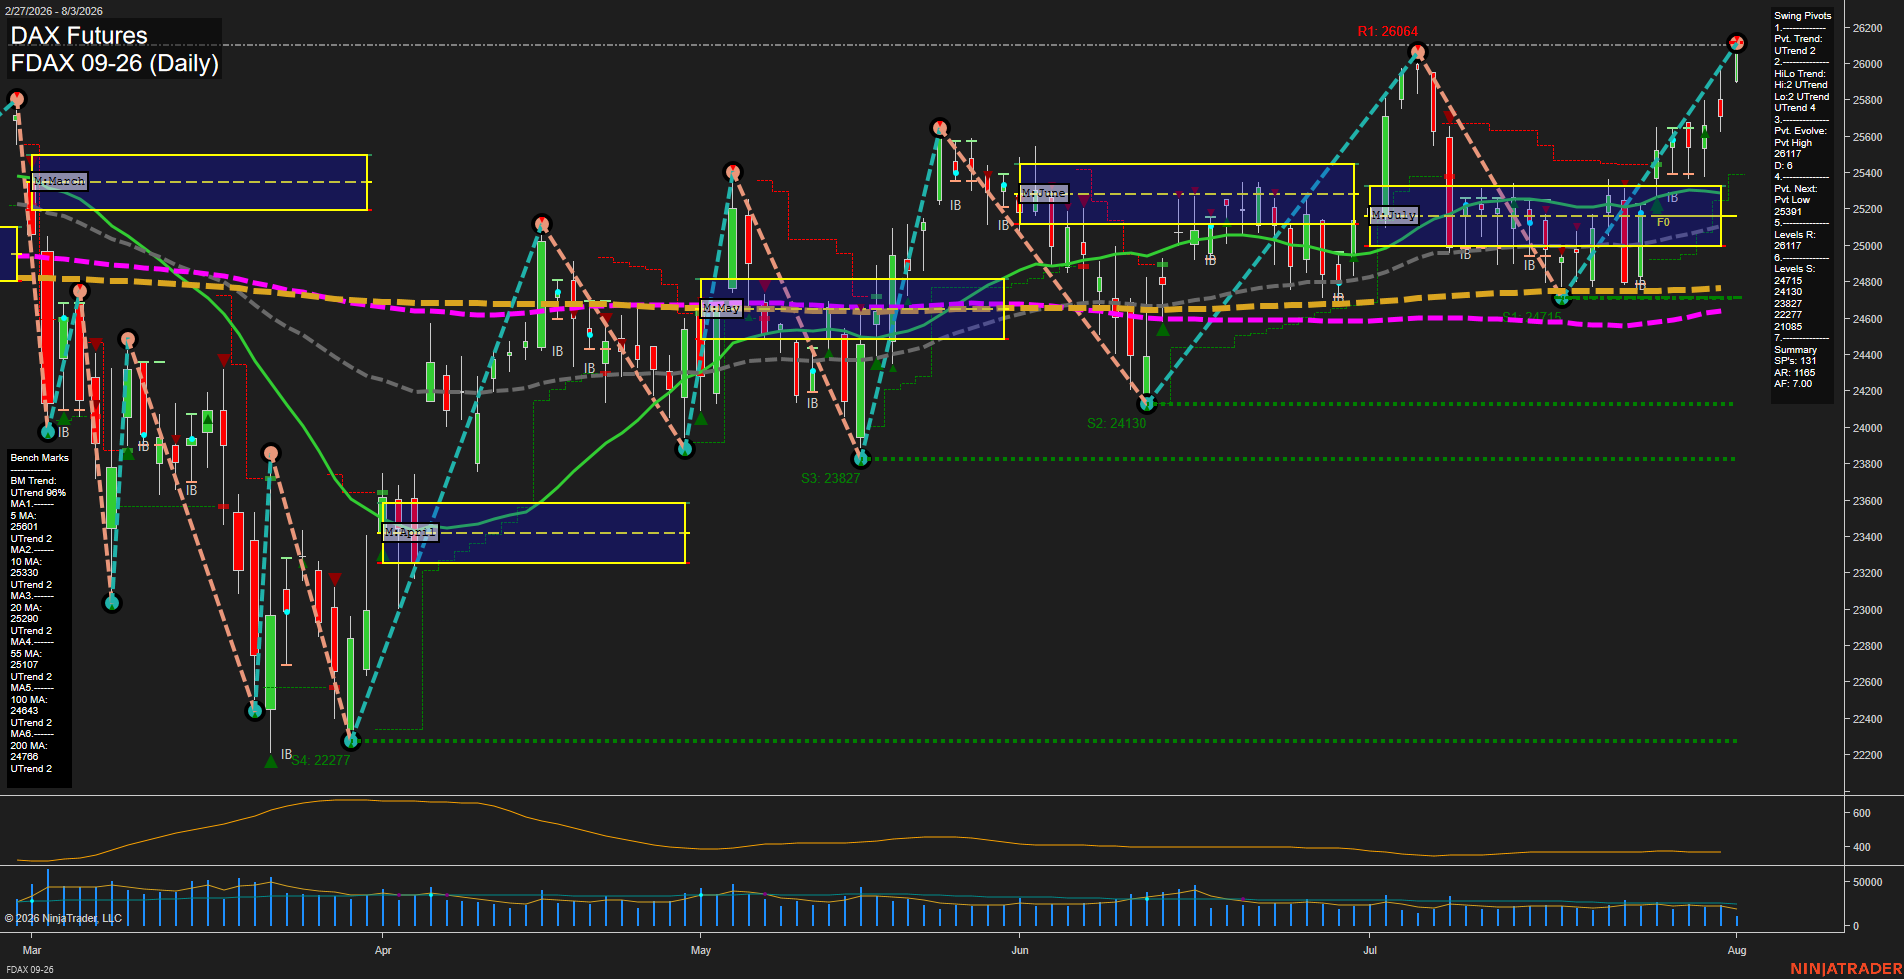
FDAX DAX Futures Daily Chart Analysis: 2026-Aug-03 07:04 CT
Price Action
- Last: 25828,
- Bars: Medium,
- Mom: fast.
WSFG Weekly
- Short-Term
- WSFG Current: 25%
- F0%/NTZ' Bias: Price Above,
- WSFG Trend: Up.
MSFG Month Aug
- Intermediate-Term
- MSFG Current: 12%
- F0%/NTZ' Bias: Price Above,
- MSFG Trend: Up.
YSFG Year 2026
- Long-Term
- YSFG Current: 34%
- F0%/NTZ' Bias: Price Above,
- YSFG Trend: Up.
Swing Pivots
- (Short-Term) 1. Pvt. Trend: UTrend,
- (Intermediate-Term) 2. HiLo Trend: UTrend,
- 3. Pvt. Evolve: Pvt high 26167,
- 4. Pvt. Next: Pvt low 25391,
- 5. Levels R: 26167, 26064,
- 6. Levels S: 24715, 24130, 23827.
Daily Benchmarks
- (Short-Term) 5 Day: 25601 Up Trend,
- (Short-Term) 10 Day: 25330 Up Trend,
- (Intermediate-Term) 20 Day: 25290 Up Trend,
- (Intermediate-Term) 55 Day: 25109 Up Trend,
- (Long-Term) 100 Day: 24643 Up Trend,
- (Long-Term) 200 Day: 24786 Up Trend.
Additional Metrics
Recent Trade Signals
- 03 Aug 2026: Long FDAX 09-26 @ 26083 Signals.USAR-MSFG
- 28 Jul 2026: Long FDAX 09-26 @ 25548 Signals.USAR-WSFG
Overall Rating
- Short-Term: Bullish,
- Intermediate-Term: Bullish,
- Long-Term: Bullish.
Key Insights Summary
FDAX retains a broad swing-up structure, with price holding above every displayed daily benchmark and both pivot-trend measures in UTrend. The late-July rebound produced higher lows from the 24715 swing-support area and carried price back toward the 26064 to 26167 resistance band. Fast momentum and medium-sized bars reflect an active recovery phase, while the recent approach to prior highs places price in a test-of-resistance condition. The 25391 pivot-next level and clustered 5-, 10-, 20-, and 55-day averages define the nearer-term pullback structure; the deeper 24715, 24130, and 23827 supports preserve the wider bullish trend hierarchy.
Chart Analysis ATS AI Generated: 2026-08-03 07:04 for Informational use only, not trading advice. Terms and Risk Disclosure Copyright © 2026. Algo Trading Systems LLC.