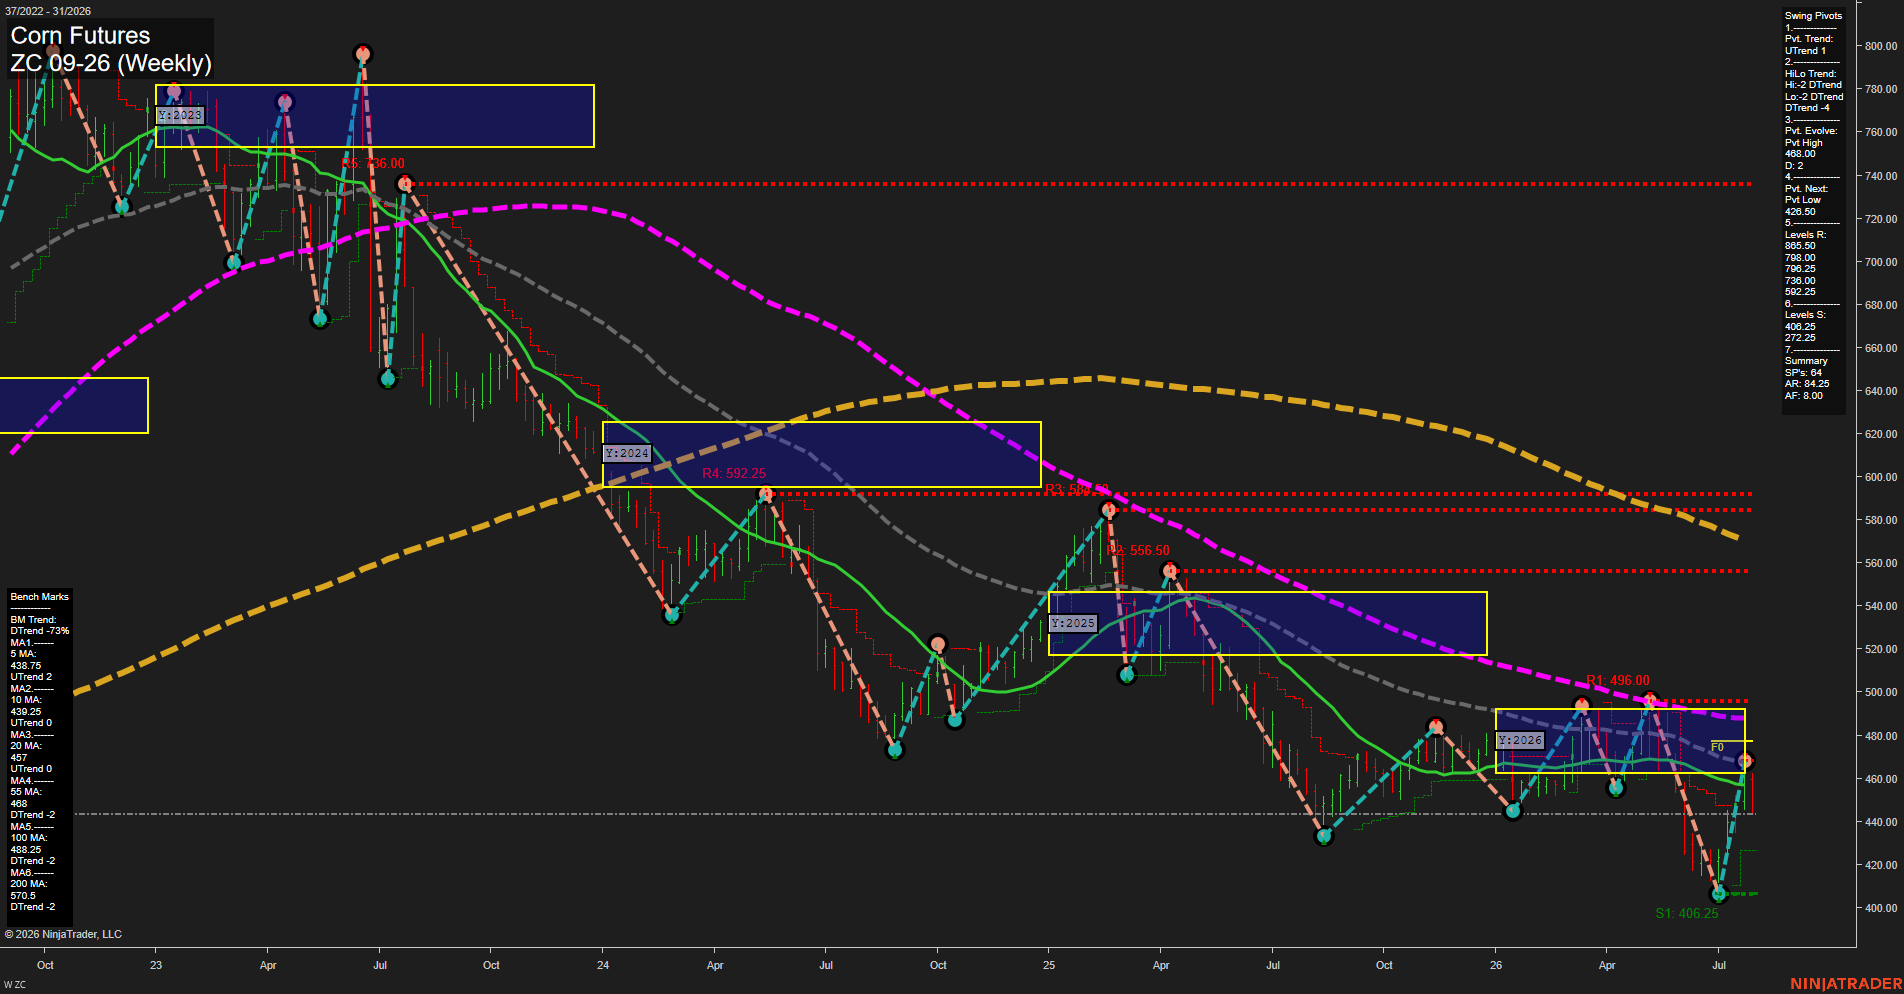
ZC Corn Futures Weekly Chart Analysis: 2026-Jul-31 07:11 CT
Price Action
- Last: 449.75,
- Bars: Large,
- Mom: fast.
WSFG Weekly
- Short-Term
- WSFG Current: -92%
- F0%/NTZ' Bias: Price Below,
- WSFG Trend: Down.
MSFG Month Jul
- Intermediate-Term
- MSFG Current: 54%
- F0%/NTZ' Bias: Price Above,
- MSFG Trend: Up.
YSFG Year 2026
- Long-Term
- YSFG Current: -23%
- F0%/NTZ' Bias: Price Below,
- YSFG Trend: Down.
Swing Pivots
- (Short-Term) 1. Pvt. Trend: DTrend,
- (Intermediate-Term) 2. HiLo Trend: DTrend,
- 3. Pvt. Evolve: Pvt high 486.00,
- 4. Pvt. Next: Pvt low 426.50,
- 5. Levels R: 885.50, 798.00, 793.25, 736.00, 592.25,
- 6. Levels S: 406.25, 272.25.
Weekly Benchmarks
- (Short-Term) 5 Day: 438.75 Up Trend,
- (Short-Term) 10 Day: 439.25 Up Trend,
- (Intermediate-Term) 20 Day: 457.00 Up Trend,
- (Intermediate-Term) 55 Day: 468.00 Down Trend,
- (Long-Term) 100 Day: 483.25 Down Trend,
- (Long-Term) 200 Day: 570.50 Down Trend.
Recent Trade Signals
- 29 Jul 2026: Short ZC 09-26 @ 449.75 Signals.USAR.TR120
- 27 Jul 2026: Short ZC 09-26 @ 455.75 Signals.USAR-WSFG
Overall Rating
- Short-Term: Bearish,
- Intermediate-Term: Neutral,
- Long-Term: Bearish.
Key Insights Summary
Corn’s weekly structure remains broadly bearish, with both pivot-trend measures in DTrend alignment and price below the weekly F0% area. The rebound from the 406.25 swing low was sharp but stalled beneath the 486.00 pivot high and the declining 55-, 100-, and 200-period benchmarks, producing a failed recovery pattern. Price is holding above the rising 5- and 10-period averages, while the monthly grid remains positive, indicating an intermediate counter-trend bounce within a larger declining cycle. The 457.00 to 468.00 benchmark zone and 486.00 pivot high define the nearby overhead supply area, while 426.50 and 406.25 remain the principal downside swing references.
Chart Analysis ATS AI Generated: 2026-07-31 07:12 for Informational use only, not trading advice. Terms and Risk Disclosure Copyright © 2026. Algo Trading Systems LLC.