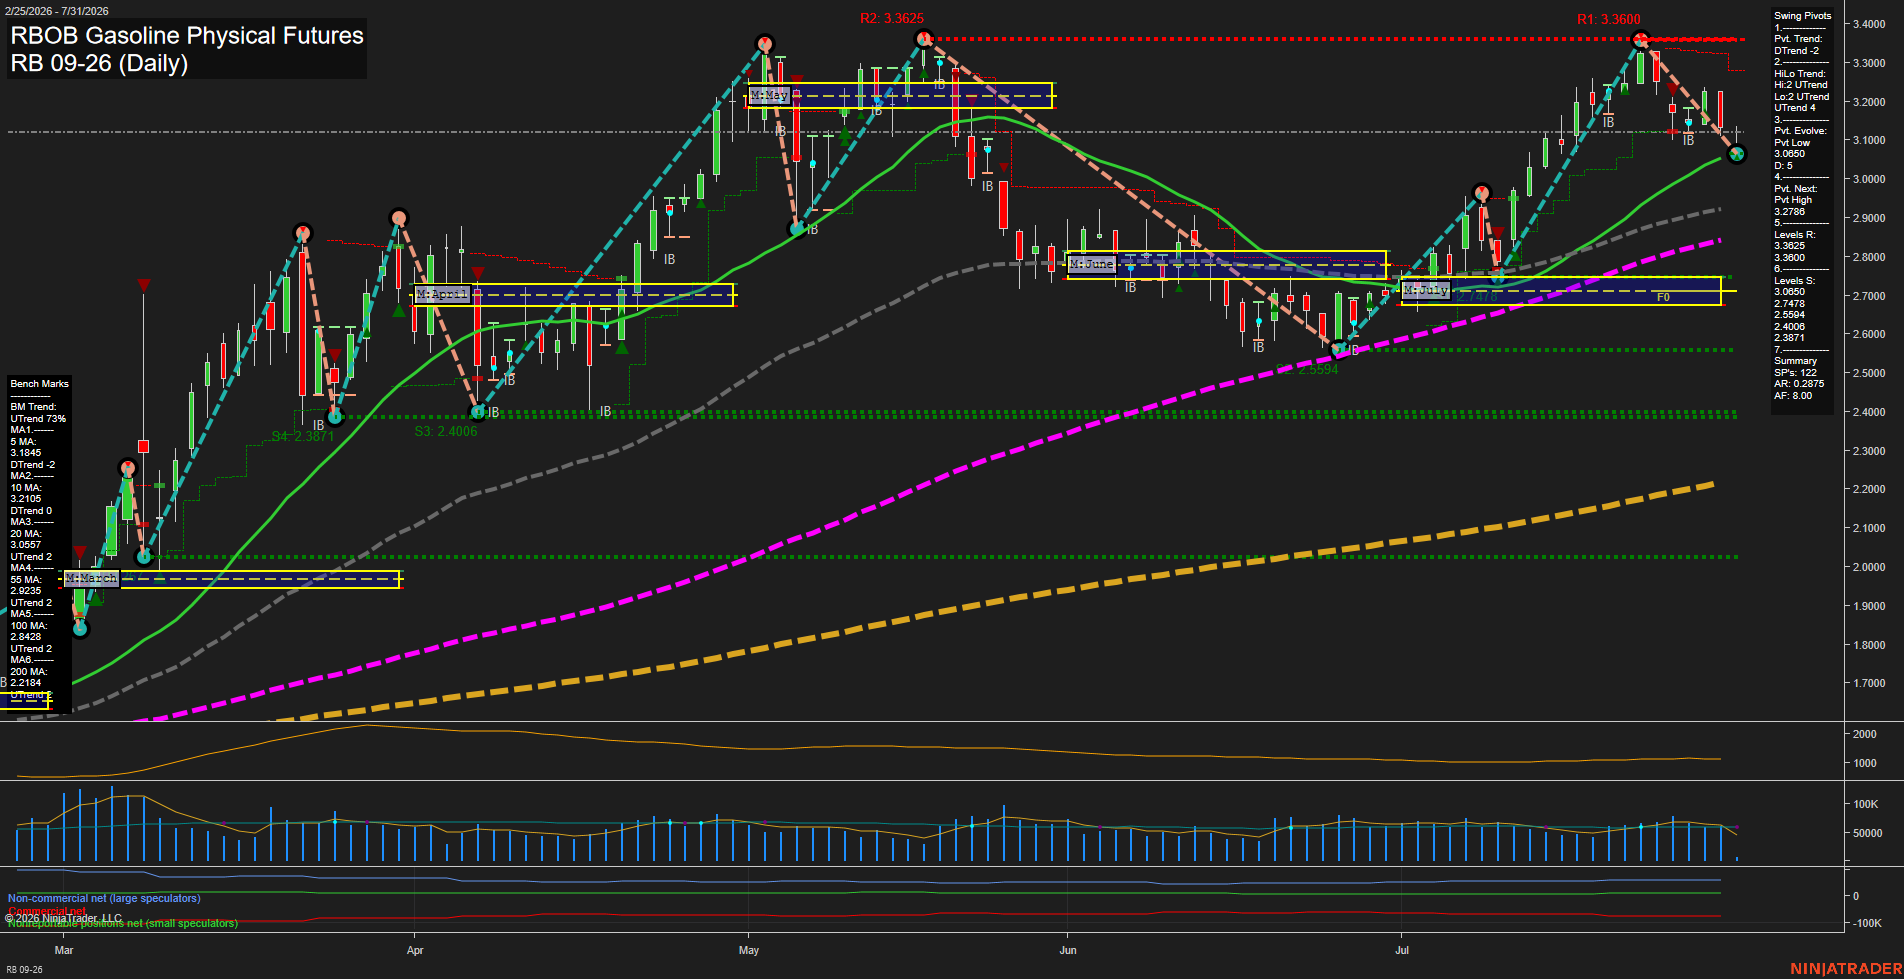
RB RBOB Gasoline Physical Futures Daily Chart Analysis: 2026-Jul-31 07:07 CT
Price Action
- Last: 3.122,
- Bars: Medium,
- Mom: Average.
WSFG Weekly
- Short-Term
- WSFG Current: -29%
- F0%/NTZ' Bias: Price Below,
- WSFG Trend: Down.
MSFG Month Jul
- Intermediate-Term
- MSFG Current: 64%
- F0%/NTZ' Bias: Price Above,
- MSFG Trend: Up.
YSFG Year 2026
- Long-Term
- YSFG Current: 167%
- F0%/NTZ' Bias: Price Above,
- YSFG Trend: Up.
Swing Pivots
- (Short-Term) 1. Pvt. Trend: DTrend,
- (Intermediate-Term) 2. HiLo Trend: UTrend,
- 3. Pvt. Evolve: Pvt low 3.05,
- 4. Pvt. Next: Pvt high 3.2786,
- 5. Levels R: 3.3625, 3.3600,
- 6. Levels S: 3.0650, 2.7478, 2.5594, 2.4006, 2.3871.
Daily Benchmarks
- (Short-Term) 5 Day: 3.1845 Up Trend,
- (Short-Term) 10 Day: 3.2105 Down Trend,
- (Intermediate-Term) 20 Day: 3.0577 Up Trend,
- (Intermediate-Term) 55 Day: 2.9235 Up Trend,
- (Long-Term) 100 Day: 2.8474 Up Trend,
- (Long-Term) 200 Day: 2.2184 Up Trend.
Additional Metrics
Recent Trade Signals
- 30 Jul 2026: Short RB 09-26 @ 3.142 Signals.USAR-WSFG
- 24 Jul 2026: Short RB 09-26 @ 3.2353 Signals.USAR.TR120
Overall Rating
- Short-Term: Bearish,
- Intermediate-Term: Bullish,
- Long-Term: Bullish.
Key Insights Summary
Daily price action reflects a short-term correction from the 3.36 pivot high, with the active pivot trend down and price trading below the 5- and 10-day benchmarks. The pullback remains above the rising 20-, 55-, 100-, and 200-day averages, preserving the broader higher-low structure. The 3.0650 pivot-low support is the nearby technical reference, while 3.2786 is the next pivot-high reversal level and 3.3600-3.3625 remains the major overhead resistance zone. Weekly fib positioning is below F0%, contrasting with constructive monthly and yearly fib trends; this defines a countertrend short-term decline within an intact intermediate- and long-term advance.
Chart Analysis ATS AI Generated: 2026-07-31 07:07 for Informational use only, not trading advice. Terms and Risk Disclosure Copyright © 2026. Algo Trading Systems LLC.